
Jun 29, 2000
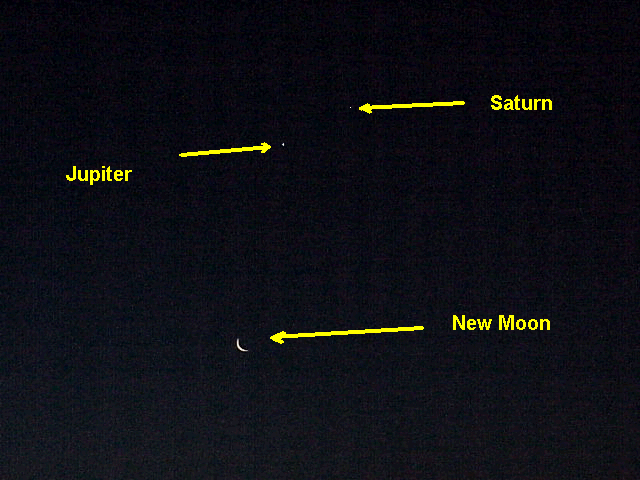
This morning, as I took my pre-dawn walk in the part with my trusty companion, Ace, we were greeted by a beautiful rising sign. This photo does not really do it justice, but here is what I saw.

I knew that the pattern would show up clearly in the market. I knew it beyond a shadow of a doubt - they always do, if one knows how to look.
I, of course, use my Chaos Trader RT program. It's my microscope for tracking
the elctric field flux lines. As you know, these flux lines come in sets related to
each heavenly body. As the bodies move, they affect the earth's electric field. And those
effects show up as currents, which traders feel as emotions. So the planetary
signs show up in price action. And ususally, a rising sign is negative.
The picture was taken between the two days at A.
The Rising Sign (JST = Jupiter/Saturn/Moon) set electric field flux "bundles"
at H and J. They set the high and low for these two days.
Prices first reacted at B, as the Exchange passed the vertical J, S, and Moon lines
at C. The energy forecast by the green +MoonTide rallied prices, but only until they
reached the Jup/Sat and Moon +M180 electric field flux lines at D.
Today, prices were lower as the rising sign became effective. Prices
held up briefly until the Exchange passed Jupiter and Saturn at E. They then
dropped sharply to F, as the Exchange passed the Moon, then Chiron and Pluto.
The low came EXACTLY on the Jupiter flux line.
From there prices rallied, having completed a "band gap energy jump" between the
two JST electric field flux bundles. From there, they rallied to the +M090
Moon electric field flux line at G. This was another "band gap energy jump",
this time between the Moon flux lines.
So you see, it is real - just as you see it above, you can find it here below.
All you need is the education in how the markets work. You have to Learn to Earn.
It's all in the Market AstroPhysics.
