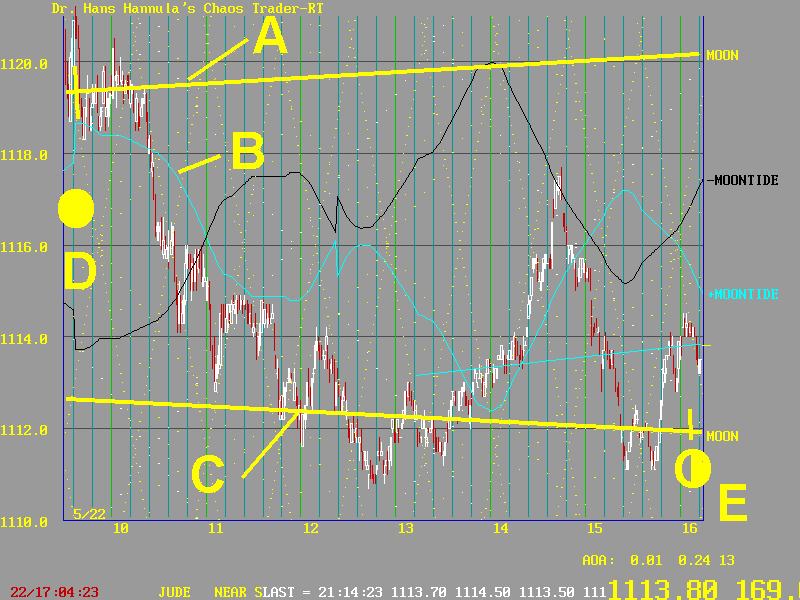


This chart shows how we used the MoonTide/S&P to make a little money on May 22, 1998.
The market opened congesting along the +Moon electric field flux line marked A. At 9:53 the Exchange passed the New Moon at D. The +MoonTide at B forecast a drop of several points. The One-A-Day trade was to place a sell stop 1.5 below price at 10:15, and a buy stop 1.5 above. That technique takes into account the fact that prices may follow either the +MoonTide or the -MoonTide. The instructions were to trail the protective stop 3 points from price and cash in a four point gain. The Cash In level was chosen based on the distance between the +Moon flux line A and the -Moon flux line C.
Prices dropped, electing us short at 10:18, from 1118.0. At 11:08 our CashIn stop was hit at 1114. We caught a "band gap energy jump." That's fun and profitable.
Prices bounced around between flux lines A and B for the rest of the day, basically following the +MoonTide until late in the day, then switching to the -MoonTide. Late in the day they were attracted to the -Moon flux line C as the Exchange lined up with the Quarter Moon at E.
MoonTides are real, physical forces. They are electric fields in motion. They cause emotional swings in traders. They don't completely forecast prices, but they are a definite aid in trading.