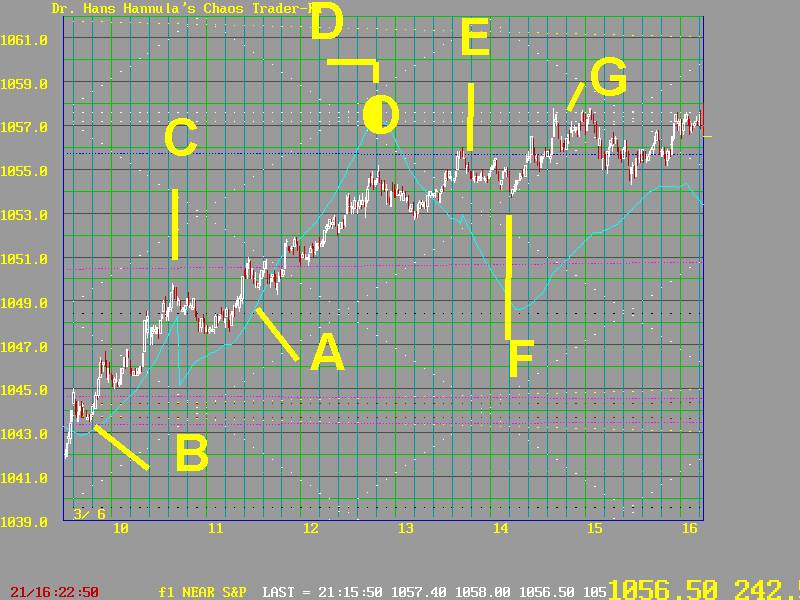


This chart shows the moon causing a fast rally on March 13, 1998. The cyan line A is a "moon energy function" similar to SP.IXGO. It is still in the research stage, but on some days it is very good. This day was one such day.
Prices formed a base on the cluster of Moon (yellow) and Mercury (magenta) lines at B. They made a dip at C, as forecast by the energy function, then rallied into a high at 12:50, at D. That is when the exchange lined up with the quarter moon. After that, the fast rally slowed considerably! Prices sagged into the forecast low at F, and spent the afternoon crossing the blue Venus line at E. The tops were set by the white Pluto lines at G.
After "hitting the moon", prices closed less than two points higher, after rising 13 points going into DA MOON*. So are all S&P traders lunatics?