by Dr. Al Larson copyright 1998,1999,2000,2001,etc Allen L. Larson
If you are seeing this page from any other site other than MoneyTide.com
There is absolutely no doubt that the moon has a major influence on the S&P 500, especially during the trading day. This influence comes from a real, physical cause and effect relationship. Everyone knows that the moon has a strong effect on the oceans. It pulls the ocean waters into massive tides. On the average the moon raises the entire ocean surface about six feet as the earth rotates. In a particular bay, the rise and fall may be far larger, due to the shape of the bay. In the Bay of Fundy, tides can rise 50 feet. So in ocean tides, there is an average level, and a "personalized" level for each bay. The same thing applies to the effect of the moon on markets. There is an average effect, and a "personalized effect." But what is it that is being tugged by the moon? What links the moon to the intraday price swings? The link is through the earth's electric field. As the solar wind carries ionized particles from the sun, they form a charged layer around the earth, called the ionosphere. That layer charges up to about +300,000 volts. The earth's surface, upon which we stand, is the zero volt end of that battery. You, me, all of us, stand in that electric field. It places a voltage of about 250 volts on our heads. It causes a current of 250,000 nanoamperes to flow though us. Our brains work on currents near one nanoampere. So these external currents are much, much larger than our bio-currents. When these currents surge, we feel them as emotions. And when we feel emotional, we trade emotionally! So prices move up and down with tides in these currents. These tides can change 20 percent in a few hours. The moon is a major contributor to these tides in the earth's electric field. At new moon, the moon is between the earth and the sun. It traps charges, lowering the voltage on the ionosphere, and on us. We feel down and sad. At full moon, the moon reflects charges that have passed the earth back into the ionosphere, raising the voltage. We feel giddy and happy. We trade according to how we feel. As the earth rotates, it moves the stock and commodity exchanges past the moon every day. It moves them under the moon, away from the moon, and to moonrise and moonset positions. These four positions can be found in the intraday price actions of stocks and commodities. Each stock or commodity has a different sensitivity to these electric tides. Just as the shape of a bay determines the response of the bay to the average tides, the nature of the market determines the response of the market to the moon tides in the earth's electric field. Learning to compute tides has taken mankind several hundred years. Only with the invention of the computer and intense mathematical modeling has the goal been reached. So it should come as no surprise that the moon's electric tides have not been computed - until now. After many years of effort, I have learned to compute the moon tides that effect the S&P 500. This is a very difficult task, and one I am proud to have accomplished. Unlike the ocean tides, there are TWO moon tides, a positive one and a negative one. They are caused by the counter-rotating waves set up in the earth's electric field. So one never has a perfect picture of which way prices will go, just when they will turn.
This is what leads to chaos is markets. The two forces work
against each other, as the buyers and the sellers compete. When
these forces balance, prices congest. When one force wins a
temporary advantage, prices move rapidly - we call that chaos.
The S&P 500 is famous for it's "streaks". It's built like the
Bay of Fundy.
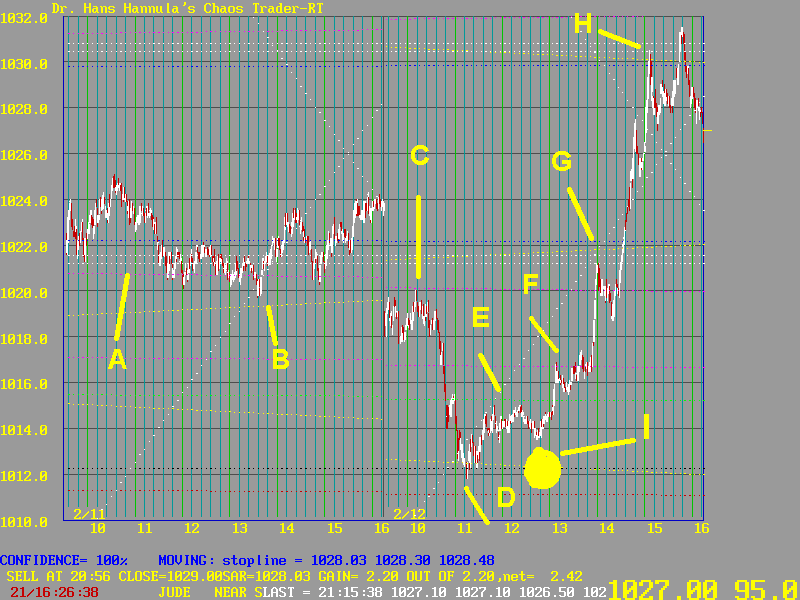
Many doubt that the planets and the moon affect markets. I don't because I watch them all the time with my Chaos Trader RT program. This program lets me draw, in advance, price support and resistance lines caused by the electric fields associated with each body. On this screen, the horizontal yellow lines are DA MOON. The magenta ones are MERCURY. The blue one is VENUS. The green one is SUN. The black one is SATURN. The horizontal white lines are PLUTO. The white line at about 60 degrees is the rotating EXCHANGE. Prices tend to congest about these lines. At A, (on Feb 11) Mercury was holding price pretty flat. And the moon was also attracting prices, as at B. Overnight, the moon line moved above the Mercury line. That made the MERCURY line a repellor. When prices touched it at C, they were driven down hard. They bottomed at D, where MOON and SATURN brought support. They started to follow the EXCHANGE line E. MERCURY slowed the advance at F. At G the cluster of PLUTO, MERCURY, MOON, and VENUS caused congestion. When that was broken, prices did a "BAND GAP JUMP" to another cluster at H. Notice how these clusters of electric field flux lines QUANTIZE price? It's pretty awesome. It's all electric fields in action. Now, notice the yellow ball marked I. That's the FULL MOON lined up with the EXCHANGE. See how it acted as a STRANGE ATTRACTOR (SA) before 12:50 Eastern, then as a STRANGE REPELLOR (SR)afterwards? That's where chaos theory comes in. Prices move from one of these SA/SR points, to another.
The trick is to find them. I work hard at that, but it is never easy.
There are at least 11 overlapping electric fields.
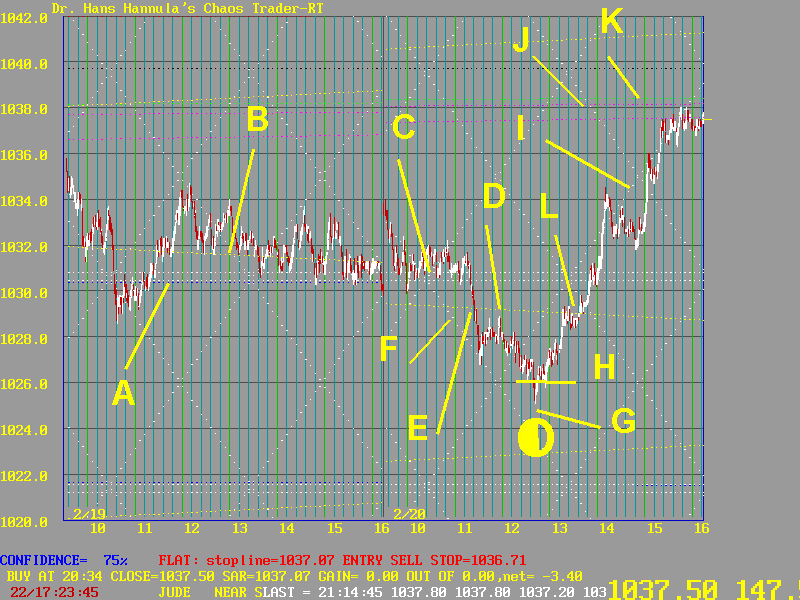
History tends to repeat. Moon patterns sometimes repeat in the market every quarter moon. This pattern for Feb 20 is nearly identical to the one eight days earlier. On the 19th, prices vibrated about the Venus line at A and the moon line at B. They were also following the Pluto line at C. In the morning of the 20th, they broke below the moon line D at point E. They followed the Exchange line at F until after solar noon. They balanced at 1026, a Chaos Balance level. As the earth rotated, it lined up the Exchange with the Quarter Moon at G. Overnight, the moon had passed the planet Pluto, associated with EXPLOSIONS. The market did just that. It broke back above the moon line at L, and followed the Exchange line I. The move met resistance at Mercury J and Sun K. Mercury was forming a conjunction with Earth. The next such pattern occurs on Feb 26th, when the New Moon is in the same position as the Full Moon was Feb 12th, and the Quarter Moon was on the 20th. That full moon is a total solar eclipse occurring south of the Exchange. Watch it.
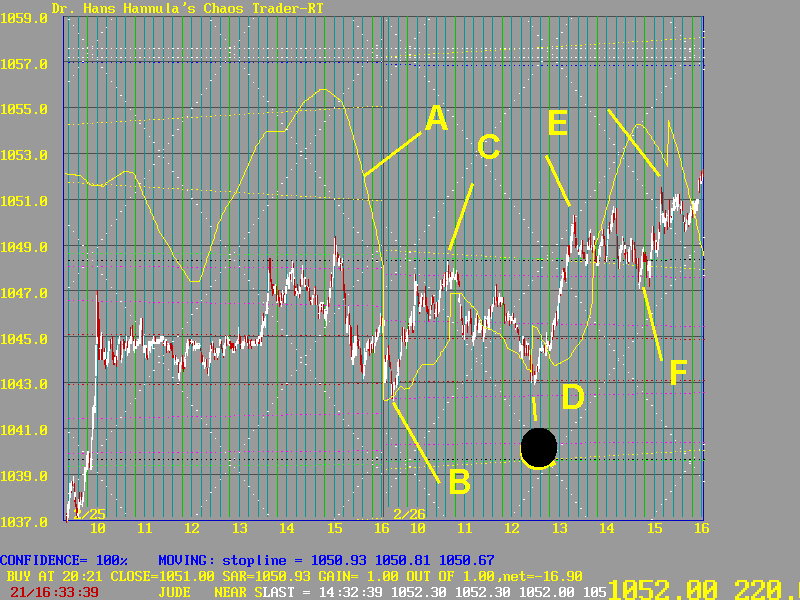
This chart shows the moon on the solar eclipse of Feb 26,1998. The yellow line A is a moon energy forecast, similar tho SP.IXGO. The day began with a bounce off of eh Mercury line at B. Prices Then ran up to the Moon line at C, and sagged into the New Moon (filled black disk) at D. At that point the eckipse was exact and the low had been tested, and the forecast was for a sharp rally. It occurred at D to E. This is a STREAK, as discussed in my Fractal of Pi course. At E prices hit the white Exchange line, which stopped the streak and let prices be "captured" by the yellow dotted moon line. At F, where the moon function shows a sharp "jerk," prices jerked upward and closed higher. This pattern is essentially the same as seen in the two previous examples of THE MOON IN ACTION. The only difference is whether the moon is the full, new, or quarter moon. This chart shows the moon causing a fast rally on March 13, 1998. The cyan line A is a "moon energy function" similar to SP.IXGO. It is still in the research stage, but on some days it is very good. This day was one such day. Prices formed a base on the cluster of Moon (yellow) and Mercury (magenta) lines at B. They made a dip at C, as forecast by the energy function, then rallied into a high at 12:50, at D. That is when the exchange lined up with the quarter moon. After that, the fast rally slowed considerably! Prices sagged into the forecast low at F, and spent the afternoon crossing the blue Venus line at E. The tops were set by the white Pluto lines at G. After "hitting the moon", prices closed less than two points higher, after rising 13 points going into DA MOON*. So are all S&P traders lunatics? * DA MOON is Chicagoan for The Moon 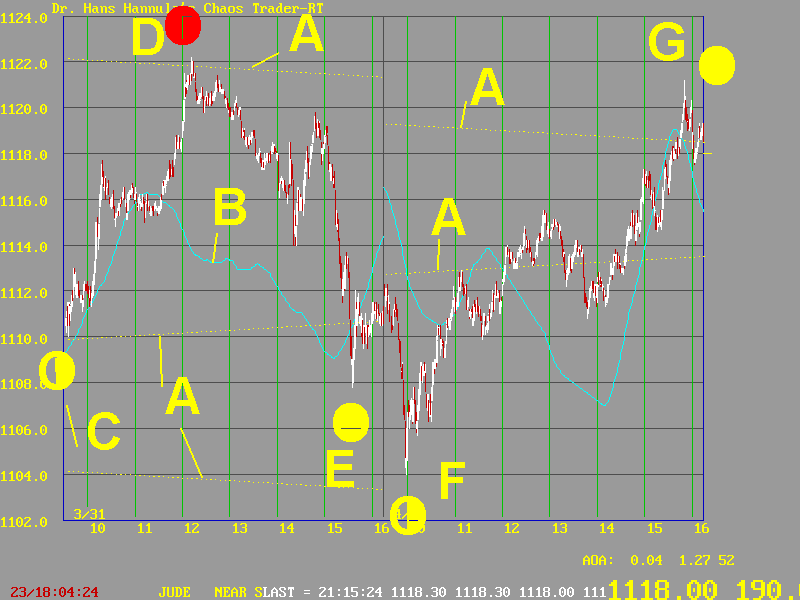
The lines marked A are the moon electric field flux lines. The curve marked B is the inverted moon function. Prices roughly followed it. Prices are show by the one minute white and red candelsticks. The quarter moon was at the Exchange before the open on March 31st. It is shown at C. Prices bottomed early on the Moon line A. They then rallied sharply until solar noon. The red ball at D is the Sun. Prices stopped on the moon flux line and headed south. They bottomed at E, as the Exchange lined up with the New Moon, the solid yellow ball. On the 1st, the declined continued until 9:58 Eastern, precisely when the Quarter Moon at F lined up with the Exchange. They rallied, and hung around the moon flux line for a few hours. Then they rallied sharply into the close, drawn by the New Moon at G. Pretty dramatic. It's DA MOON again! A picture is worth a thousand words, and a series of many pictures is worth many thousand words. At the bottom of the Chaos Clinic page are links to many illustrations of the moon in action in the S&P 500. If you go to that page and read each page with the title THE MOON IN ACTION -xxx, you will see how the moon operates to move the prices of the S&P500. |
CLICK HERE TO GO TO THE CHAOS CLINIC
