
February 18, 1999
Lunar and Solar eclipses usually occur in pairs two weeks apart. If one studies carefully the result of theri passing, one can often get a clear idea of where the prices are headed.
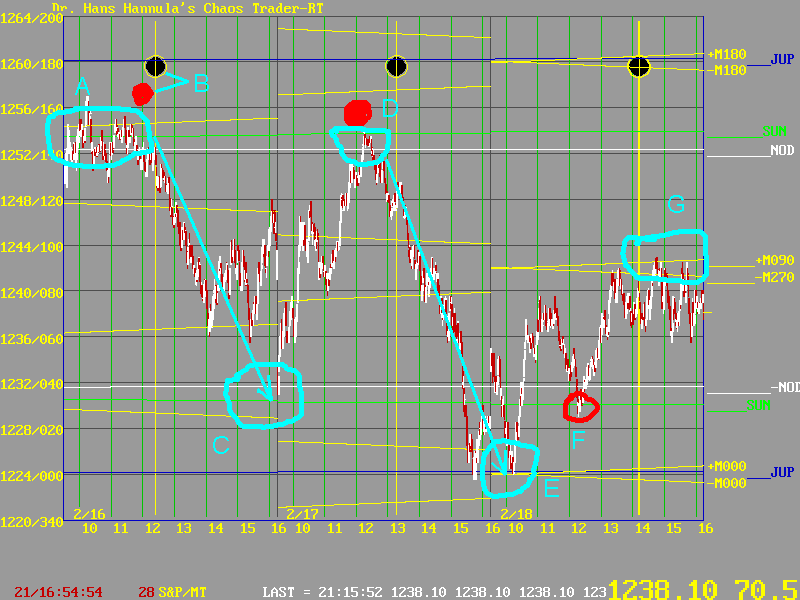
Earlier, we saw that the lunar eclipse sent prices lower. This chart shows the effect of the solar eclipse of February 16, 1999.

The key point to watch is which way prices move from the level set by the eclipse. The eclipse price level was formed at A, where the Sun, Moon, and Node electric field flux lines converge.
Prices vibrated about this price level until the exchange passed the Sun and the Moon at B. Then-whamoo! Prices did a "band gap energy jump" to the other quantum price level set by the Moon, Sun, and Node at C.
From there, on February 17th, they rallied to retest the price set by the eclipse, at D. And as soon as the exchange rotated to collect the eclipse energy, again-whamoo! They fell sharply to 1224, at E.
At 1224, another factor came into play. The Moon was passing Jupiter on February 18th. That caused a crossing of the yellow Moon electric field flux lines at E, and prices rallied.
But they did not go far. They were pulled back to the Sun electric field flux level at F, as the Exchange passed the Sun. Eventually they rallied to close just under the Moon electric flux lines at G.
So when one has the proper knowledge and tools, one can see exactly what effect an eclipse has had. This one has pointed the market down. Unless Tuesday's highs fall soon, the market is going south for the spring.
Remember, it is all energy in motion. You can see it. You can compute it. You can use it in your trading. Knowledge is power. You have to learn to earn.