
This next section was in the Cash In On Chaos Newsletter:
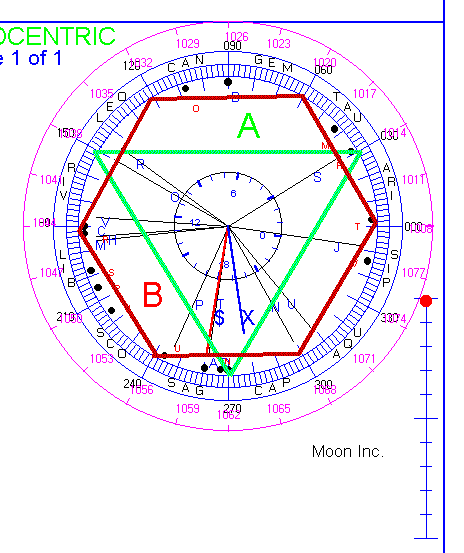
The Ephemeris wheel at the below was taken off of my online system the
night of September 28, 1998.

This system constantly reads the price of the S&P, converts it to degrees on the wheel, and overlays it as if it were a planet. It also does the same thing for the position of the exchange. This aids in watching how prices are responding to the moving planets. This particular pattern is significant in that it forms both a triangle (trine) as shown at A, and a hexagon (6th harmonic) as shown at B. Readers of my web page material know that I watch the hexagon in the S&P very closely. Currently that hexagon is anchored on the left hand side of the wheel with the Sun, Mercury, and Venus conjunct and on the right hand side of the wheel with Jupiter. The lower left corner of the hexagon is anchored by Pluto and the lower right corner of the hexagon is anchored by Neptune and Uranus. This is a stable position of the hexagon.
However, the trine is unstable. Its corners divide the hexagon sides in half. This leads to the phenomena known as "frequency doubling" which is a precursor to chaotic behavior. This triangle is being formed by Saturn and the Node. Currently Mars is transiting the Node adding energy to that triangle. Mars is known to astrologers as the planet of war, anger, and aggression so it tends to have a negative effect. The bottom of the triangle is being transited by the Moon, labeled T; price, labeled with a $; and the exchange, labeled with X. This tells us that price is responding to the triangle, rather than the stable hexagon. Further, the Moon's inclination, shown in the vertical bar to the right, is peaking. This makes the Moon most effective. This pattern tells me that a negative turn in the market is starting NOW.
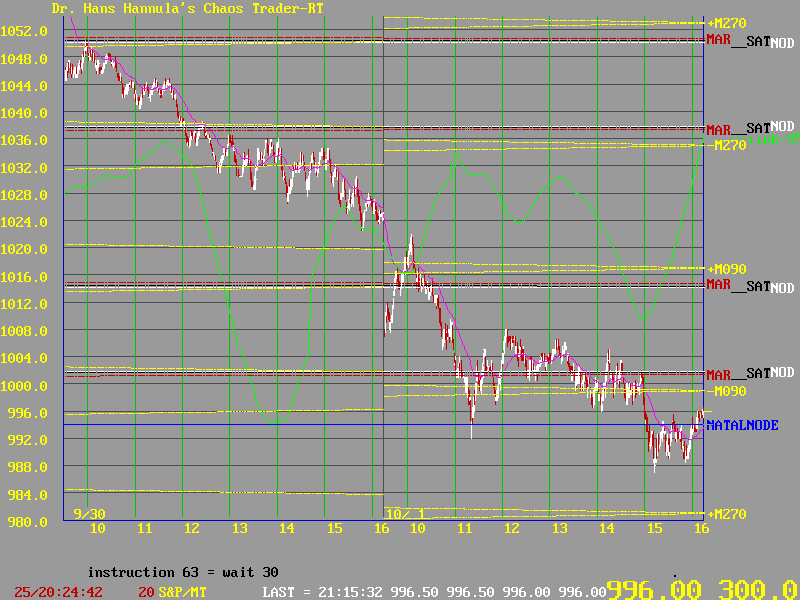
Here's the result a few days later:

Note the electric field flux lines labeled MAR, NOD, and SAT. They are the coverging fields of Mars, the Moon's Node, and Saturn. The trine set up the vibration to these flux lines. Prices spun counter clockwise around the circle to the the bottom of the trine, at a price of 990. The price of 1002 is 180 degrees to Mars transiting the Node, and the S&P natal node is at 994. Note that it was the Moon that triggered the move. Chaos occurs when larger forces balance. Then a smaller force can trigger an avalanche, which is then fed by the dominate larger force. It's all arc, sparks, and chaos.
The green line is the MoonTide line. It worked pretty well to forecast the intraday moves. But it takes a complete understanding of Chaos to see how all the pieces fit together. I don't always see how things are fitting together, but I saw this one.
On a longer time frame, this is the 5th move in a down Chaos Clamshell from the July high. So this pattern set up the 5th move, which can be NASTY.