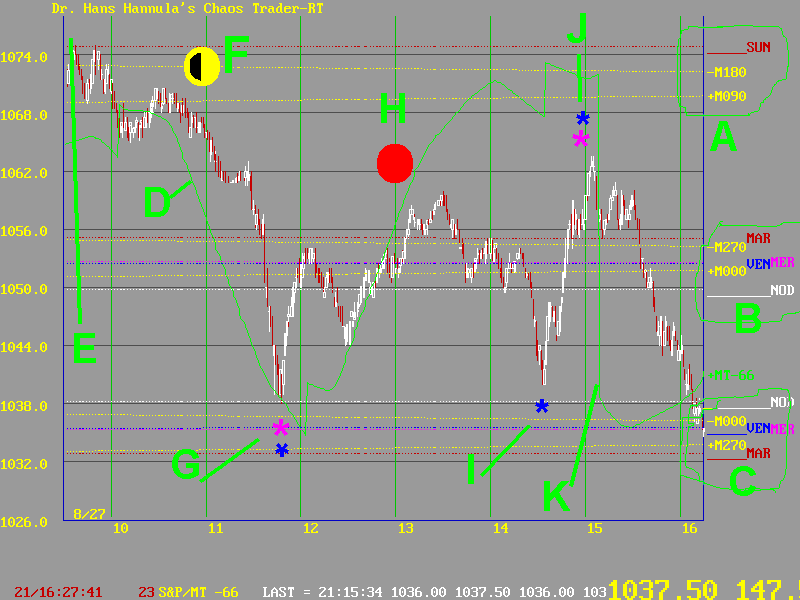

This chart shows the S&P 500 on August 27, 1998, a day when the DOW dropped 360 points. Besides the collapse of the Russian ruble, there was more going on. This chart shows what was happening in the energy fields to cause such chaos.

First note the Moon electric field flux line clusters at A, B, and C. Note that they were 180 degrees apart, giving lots of room for prices to move. Note also that these clusters have Sun, Mars, Mercury, and Venus tightly clustered. This indicates very strong syncronization of these fields. That set up the background for the day.
The MoonTide line at D showed high MoonTides. The Tides were shifted to the left 66 minutes, one of two possible theoretical values. Unfornutately, I picked the other value for the One-A-Day forecast. Fortunately, the trade was never elected, so it was a learning day.
What powered the decline was a heliocentric Mercury 30 degrees to Jupiter at 9:34 Eastern, shown at E. That started the vibration of prices, but they were "stuck" on the Moon Flux Lines -M180 and +M090 at A.
Then the XCHG rotated under the Quarter Moon at F, and the market dropped like a rock - rather it did a bandgap energy jump through the flux lines at B. What caused the penetration of the lines at B was the XCHG lining up with Mercury and Venus together at G. Mercury was "hot" because of the 9:34 Mercury-Jupiter aspect. After passing that point, prices pulled back up to the B flux lines.
The pullback was as per the MoonTides, and continued up to solar noon at H. Then prices fell away from the flux line, pulled down to Point I, when the Exchange opposed Jupiter. Jupiter was "hot" because of the 9:34 Mercury-Jupiter aspect.
Then prices shot up to point J, as called for in the MoonTides. This was also due to 3:00 PM being 4 hours, 1/6 a day, from the quarter Moon at 11:00. This is the 6th harmonic the S&P resonates on. This point was also 3 hours or 1/8 a day from the Mercury-Venus pair at G. This combination of harmonics caused the price spike.
After this "resonant peak", prices dropped sharply. This was called for in the MoonTide, which had a vertical "overnight gap" moved back into the trading day by the -66 minute shift. This is shown at K.
Finally, prices closed on the flux lines at C, completing a double "bandgap energy jump."
Isn't it amazing how the Moon and Friends can bring us such nice, orderly Chaos?