
AUG 26, 1999
On July 1st I wrote THE MOON IN ACTION LXV-THE FULL MOON FED. At that time, the Fed raised interest rates - and the market went up, rather than down as market folklore says it should. This week, history repeated itself. The similarity is striking. In both cases, the Full Moon was the source of this "lunatic behavior."
Here is what happened this time.

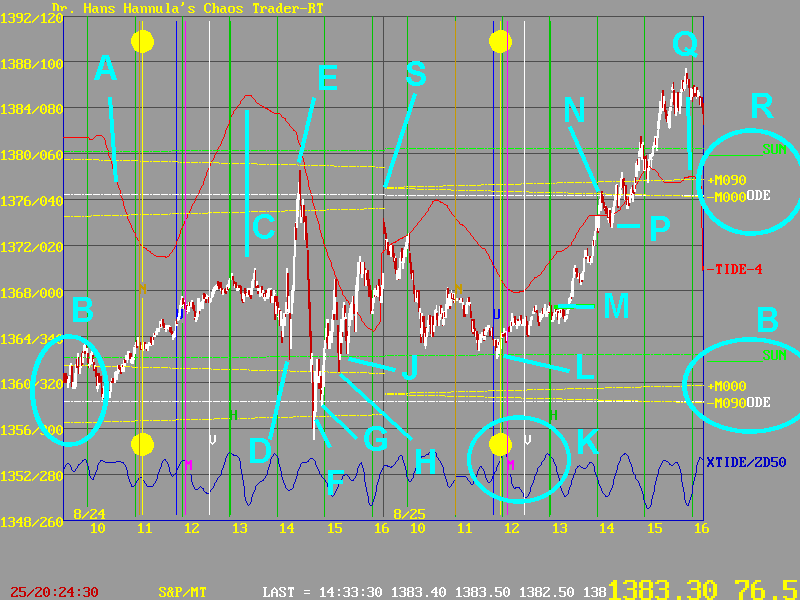
Prices started out near the electric field flux cluster at B.
This was formed by the Moon, Node, and Sun-the players in an
eclipse. The full or new moon before or after an eclipse
are often as powerful as the eclipse.
Prices sagged going into the Fed annoucement. Then CHAOS STRUCK. When it was made,
prices dropped sharply to the Sun flux line at D, then "band gap jumped"
to the -M000 Moon flux line at E. One of our suggested trades was to sell at
1378 with a two point stop. It took guts to do it, but it was a
great "Moon Bounce" trade.
Prices dropped 23 points in minutes to the +M000 Full Moon flux line at F,
then bottomed at the Node line at G, bottomed again at H on the -M090 flux line,
and make a third bottom at J on the Sun flux line.
So the whole Fed event left prices balanced about where they were at C,
after whipping them "rail to rail" between the two quantum levels
set by the Sun, Moon, and Node at B and R. But there was more to come.
Overnight, the Moon electric field flux lines crossed, shown at S.
And on the 25th, they were "pinched". This often leads to a fast, big, move.
Futher, the Full Moon, shown by the vertical yellow line with the ball on it,
had moved to align with Uranus, Mercury, and the Sun. This cluster is
shown at K. The -MoonTide forecast the low of the day here. So that's where
I placed the One-A-Day trade.
The low came at L, right on the FULL MOON. And it came at the Sun flux
level. Then the market began to rise, electing the One-A-Day long at M.
Prices then jumped up to the -M000 FULL MOON flux line at N. The
NODE flux was also there. This resistance caused a pullback into P,
which stopped out our One-A-Day for +6.9 points, or $1725 before
slip and commissions.
From there the rally continued, until peaking at Q, on the last -MoonTide
high. At the close, it was settling back to the quantum level at R.
So the FULL MOON affected the market reaction to the rate cut, just like it
did in July. Of course, there were more players involved.
From all this, you can see that the Fed's action was coupled into a dynamic
market system that was not yet in a state to turn down. It's like pushing
a child on a swing. You can only push the child when the swing comes back to
you. Push when the swing is away, and the effort is wasted. The swing comes
back toward you, even though you pushed. So the illusion is that the push
had the effect of a pull. That's what happened to the Fed
when the market caught FULL MOON FED FEVER.
You may now want to revisit THE MOON IN ACTION LXV-THE FULL MOON FED.
The similarities are striking.

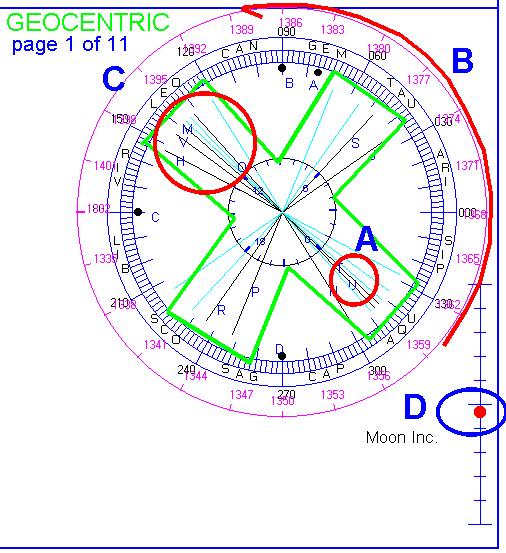
This is the ephemeris wheel for the event. The Grand Cross is outlined in green. The
Moon crossed the south-east leg at A. It was very powerful , as it was
nearly on the ecliptic plane (D), forming what I call a Near Eclipse. Prices rallied along the arc at B, covering
3/8 of a circle. The attractor for prices is the north-west leg of the Grand Cross,
where Sun, Node, Venus, and Mercury are clustering near 1395. 1395 is the .779
"Chaos Retracement" of the July-early August decline. I expect it may be the rally high.