
September 22, 2000
Everyone knows that the bull market that began in 1994 will someday come to an end-a very nasty end. But many have gone broke trying to guess that this bull market was dead.
Rather than guess, one can use Market AstroPhysics to study the cause of a move, with the hope that such study will tell you when the move will end.
W. D. Gann sometimes spoke of a "death line" - a support line, that when broken, indicated the move was over. I have seen one example of a Gann chart showing such a move. That one was based on the Moon's Node.
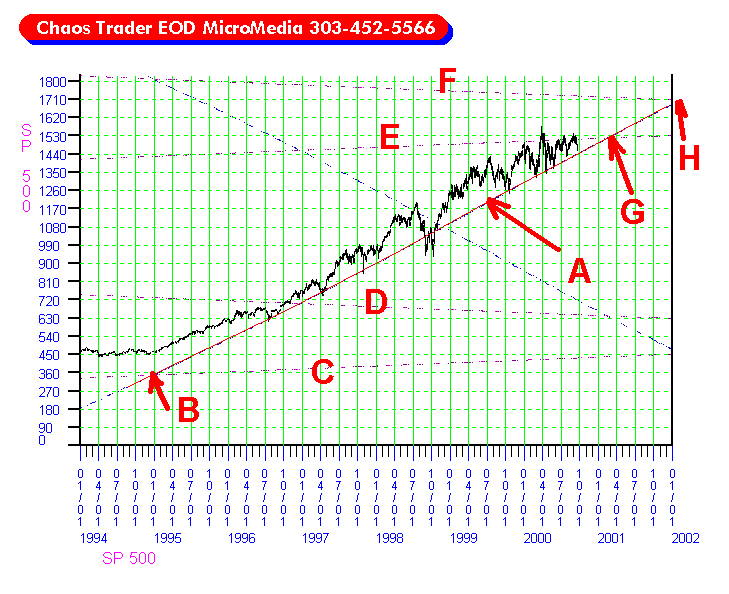
The chart below shows my own "death line" for this bull market.

The death line is the red line at A. It is an electric field flux line based on the motion of Jupiter. Jupiter is the Bull planet.
The bull market began when Jupiter passed Pluto, shown at B. The lines C, D, E, and F are Pluto electric field flux lines. Notice that they form "quantum levels" just as the Moon lines do on the intraday charts.
The market has made a "Band Gap Energy Jump" from the lower quantum level (B,C) to the upper level (E.F). Just like in the many intraday examples, the move slows once the new quantum level is reached. You can see how the line E has been slowing the move.
That does not mean the move is yet over. But the death line is VERY VULNERABLE. Key times are at G, and H, where it passes the Pluto flux lines.
So watch the Death Line 2000. If it is broken, SELL, SELL, SELL. You will have a physical reason for doing so!