
JUNE 24, 1999
I felt double-crossed today. We had a great One-A-Day trade specified to sell early and cover at 12:30. But we were just a bit too cautious on our entry rule. We said to wait for a 4 point rally and then trail in an entry stop 3.0 under price. That never happened before our 12:30 exit time. So our trade was never elected on a day when we had a great forecast. That happens.
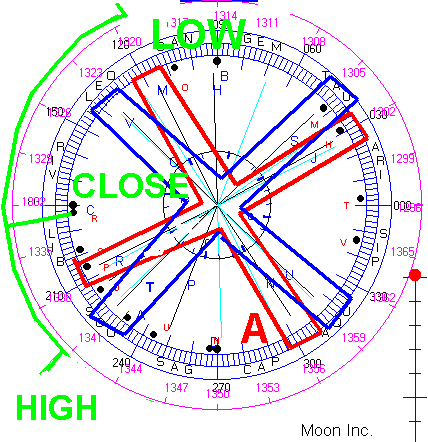
But there is something to be learned from this double cross. Look at the ephemeris wheel below.

On the left of the wheel I have marked today's price bar. The high was on the T leg of the blue Grand Cross. The low came on the M leg of the red Grand Cross, The close was midway between the T and and the V,O leg of the blue Grand Cross. The Moon "pulled a double cross."
Now let's look at the price chart.

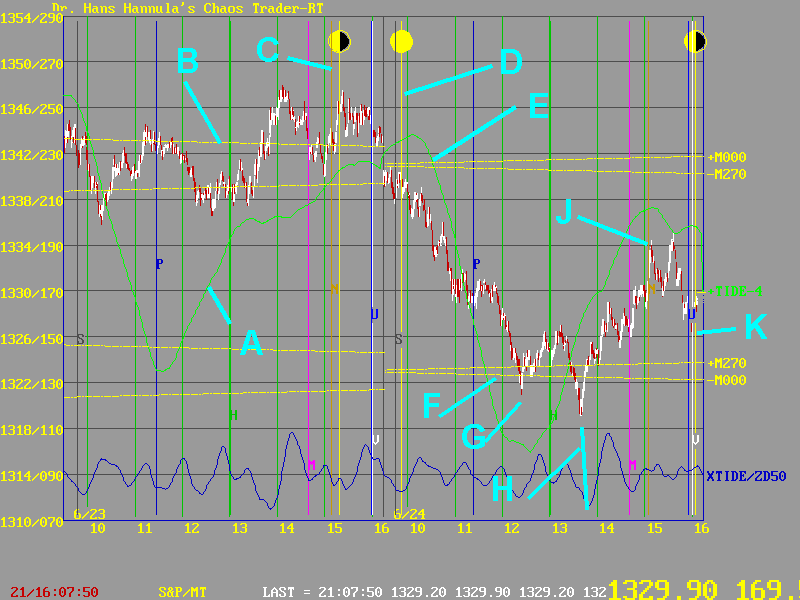
Today opened with the Full Moon lining up with Saturn at D. Note that the Moon flux lines had crossed, and that now the +M000 line was on top, and it became resistance. This is shown at E. Where these flux lines and the vertical Full Moon line cross is the center of a chaotic Strange Attractor/Repellor.
As soon as prices passed this point, it became a repellor, and the band gap energy jump was on. It lasted until prices hit the next quantum level of Moon flux lines at F. The first low was at G, right on the 12:30 target time. There was a second low at H, on the XTIDE low. Rememeber that XTIDE represents the "rumble of the rotating earth."
That 12:30 low was midway between the Saturn leg and the Venus-Node leg of the blue Grand Cross-the one "completed" by the Full Moon. That marked the 8th harmonic point of this pattern. Prices then rallied up toward the V-O leg, which is 180 degrees to Uranus. But before they completed that swing, they encounted the Mercury-180 to Neptune leg of the red Grand Cross, which turned prices down. If you look carefully, you can see the vertical brown line with the N beside it, right on the late high at J. The other Grand Cross marked the late low at K.
And that's how the Moon worked with the planets to bring us today's market action. MoonTides forecast the general events, and the wheel shows the detail. So even though we missed a good trade, we did not lose, for we gained knowledge, insight, and experience.