
January 15, 2001
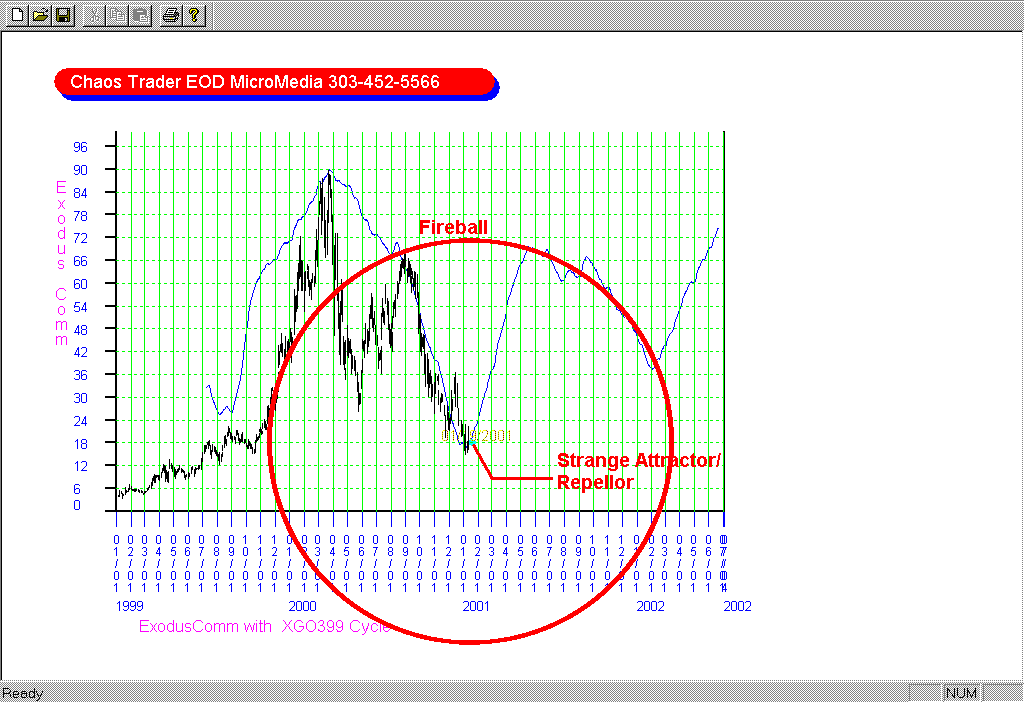
Last week, in the article, Lunar Eclipse 2001, I showed how I used my technology to find the chaotic Strange Attractor/Repellor in the S&P500. This was a short term pattern-with the moves measured in days.
This page shows a similar pattern on a stock-Exodus Communications (EXDS). This pattern is on a longer term basis, with the moves measured in months.
This chart shows that prices have moved to the center of a fireball. They cannot stay there. Using my new discovery, I determined that the cycle causing this pattern was 399 days. So I used a 399 day Zero Delay filter on the EXDS XGO energy to forecast the direction of movement away from the strange attractor/repellor. The XGO399 energy curve is forecasting a sharp rally back to the edge of the fireball.
Keep in mind that I am using a new discovery in this work. It is theoretically sound, since it is based on First Principles. I have seen it work spectaculary once (in the S&P ) on a shorter cycle-in real time (the only true test).
Time will tell us the true value of this new method. But I have a good feeling about this one, because it came to me on Epithany Sunday, as I was listening to the story of the 3 Magi visiting the Christ child.
I love that story. I think those 3 Magi were the greatest forecasters ever. They set my high bar of aspiration. The three stars in the Cash In On Chaos graphic at the top of the page are in their honor.
So you might want to keep an eye on this stock.

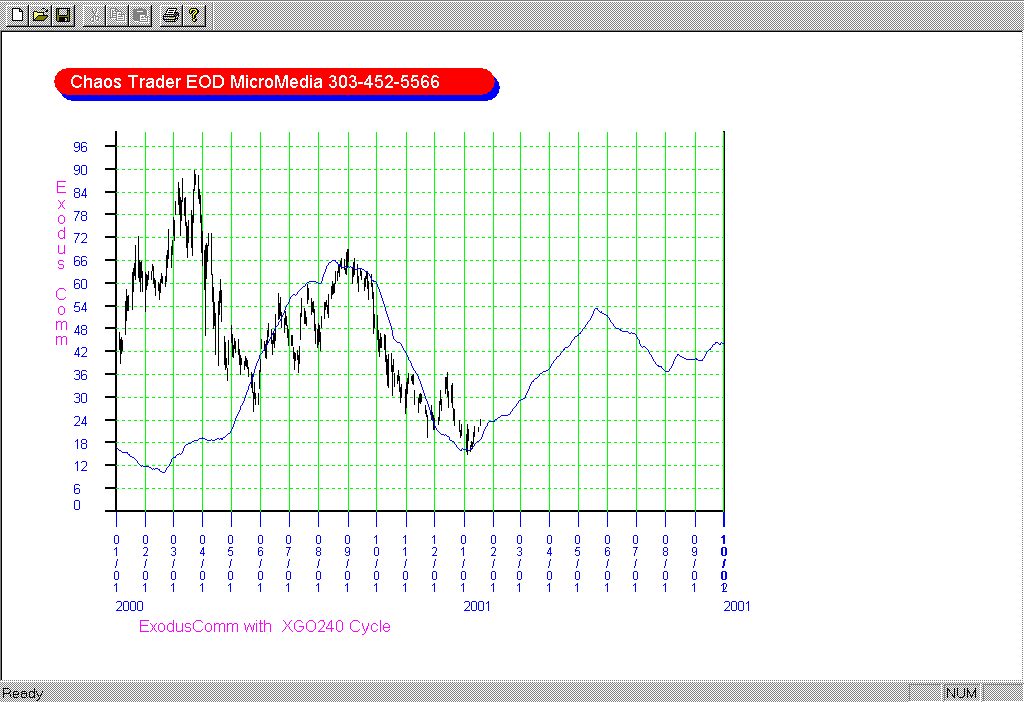
This chart shows the 240 day energy cycle that formed the inner fireball in EXDS. Note that it calls for a rally that matches the length of the rally from the 399 day cycle. So both cycles are up for the same time.
