
This chart shows the S&P 500 on October 14 and 15, 1998, a day when the DOW jumped 330 points. Besides the 1/4 point cut in the federal funds rate, there was much more going on. These chart shows what was happening in the energy fields to cause such chaos.
This is a long page, so you may want to print it out to make reading it easier. Or open two copies of your browser and use one to look at the charts and another to scroll through the text.
Everyday I look at an ephemeris printout from my WinGephi program. It shows me the planets, both geocentrically and helio centrically, overlaid on a wheel with the S&P's natal planets.
Whenever the market does something I didn't expect, I study the "wheels of fortune" carefully. On the 13th, our POSITION TRADE in the S&P was stopped out at 1020. We were short 8 contracts from 1036.23 average, and positioned for more downside. But a move to 1020 indicated that something unusual was UP.
A price chart (not shown) overlaid with my Fractal of Pi pattern, showed that before continuing the Crash of 1998, we were in for a SHARP RALLY.
So I turned to my WinGephi charts to see who might be sparking such a rally. The chart below is the geocentric wheel for October 15th. Don't be intimidated by all the marks. Take them one at a time. This is a complex system, and a lot was going on.
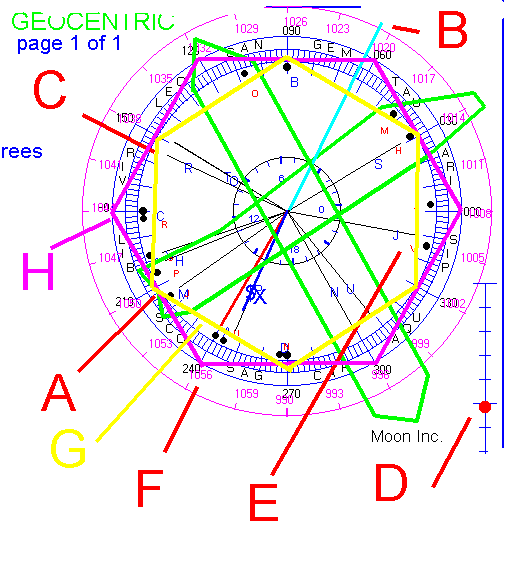
Start with the green Grand Cross pointed to as A. The Cross was being set up by Mercury M 180 degrees (opposition) Saturn S, 90 degrees (square) to Uranus U, with Neptune N nearby. This Grand Cross aligned with the S&P 500 natal (black dots with red letters) Jupiter J, Sun H, Pluto P, Mercury M, and Node O. Look carefully and you can find all of them inside the green cross.
Now look at the two hexagons, one in magenta as H, and one in yellow as G. The magenta one is the stable S&P hexagon, and the yellow one is the unstable one. See earlier Moon In Action pages for more on these.
Note that the current Pluto, shown at F, whose P is just visible under the blue X and S, has an opposite corner at B, near the price of 1020. Prices are shown in the magenta overlay circle around the ephemeris wheel. I put my short stop at 1020 because I knew that a rally past that price would mean the Pluto Lunatics were out, and buying like crazy. I've learned about Pluto Lunatics from experience and lots of observations.
At C, the Moon T, the Moon's Node O, and Mars R, anchored the yellow hexagon. This one has vertical sides, and can lead to vertical moves. The moon's inclination was at 0, meaning it was smack in the ecliptic plane, as shown at D. This makes the moon VERY POWERFUL. Note by the small clock in the center of the ephemeris wheel that the Moon and the Node are near the OPEN at 9:30 Eastern and Mars is just before 10:00. That timing set up the entire day.
E points to current Jupiter J, conjunct natal Venus V. Jupiter is sort of between the two hexagons, in a position to set up a switch from one to the other. Note the price of 1005.
The close is shown at F by the blue X, for Exchange. This screen was grabbed at 15:57 Eastern, October 15th. The red line at F is price. Note how both had settled in the corner of the stable magenta hexagon. How price got there is very interesting.
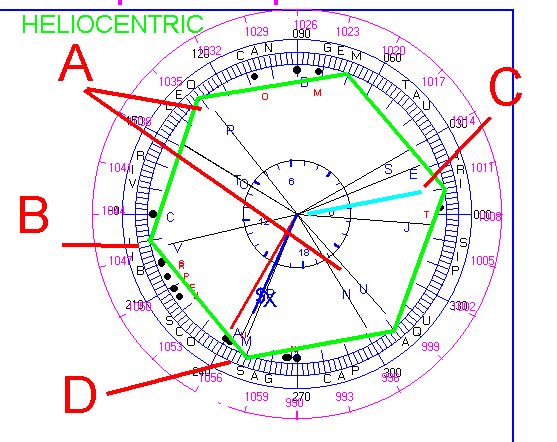
The helio wheel above shows the planets as they act on the sun to generate tides in the solar radiation.
At A, Mars R opposes Uranus. Venus at B is 60 degrees away, setting up the hexagon shown in green. Venus opposes the midpoint of Earth E and Jupiter J, at C. At D, Mercury M and Pluto P are conjunct. This set up a very strong 6th harmonic wave in the sun's energy radiation.
This meant that Mercury was transiting Saturn geocentrically, and Pluto geocentrically. The ancients called Mercury Satan. Many Bible passages talking about Satan are really talking about Mercury cycles.
So what did these patterns set up in the market? Observe these charts.
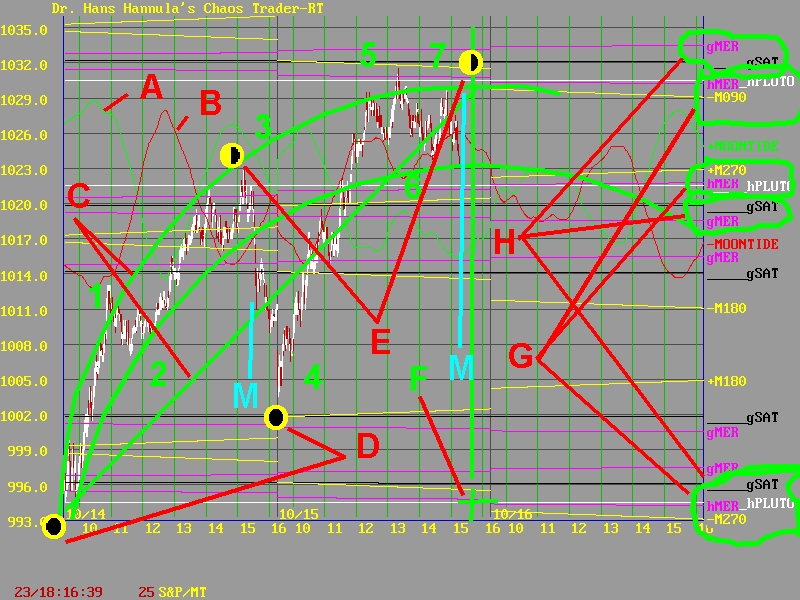
This chart shows three days, October 14, 15 and 16, but were recorded at 3:14 PM, Eastern time on the 15th. They show a very nice pattern.
On the 14th, the Exchange rotated past the New Moon before the open, and on the 15th, right at the open. These are shown by the yellow border, black filled circles at D. The Node was also near the open, as was Mars. These points set the lows both days.
The highs came near the Quarter Moons at the Exchange, shown at E, with the half black, half yellow symbols. These marked the highs of each day.
The +MoonTide in green is at A, and the -MoonTide is at B. The 10:30 high in the +MoonTide on the 14th was at the end of the 9:30 to 10:00 streak, and the pullback was much weaker than forecast. But the rally from 12:30 on was strong. It ran up into the the high near 2:30-3:00. That was where the Quarter Moon was. After a late rally attempt, prices dropped sharply at M (light blue) on the 14th. This was where the Exchange lined up with Mercury and Pluto.
On the 15th, prices switched to the -MoonTide (red), following it to a mid-day high. Then prices began to congest. The two day pattern had formed an UP Chaos Clamshell, shown in green at C. One can see the 7 moves numbered in green. The top of the CC was a vortex swirl, and the base line was a straight line. So one would thing this thing was over.
The end of a Chaos Clamshell is a point where one can expect CHAOS. Usually, prices start another CC in the opposite direction. But not this time.
Note that the prices of the low, high, and important support points within the CC were set by the Moon, Mercury (both geo and helio) and Saturn geo and Pluto helio. These price levels are labeled at H and G. They are set by the electric field tides set up by these planets in the earth's electric field. The small labels on the right have an h, as in hPLUTO, for helio, and a g, as in gSAT, for geocentric. So one can see that prices were reacting to the ephemeris wheels pretty normally.
Enter the Fed, and Chaos.
The planetary system gives multiple solutions to the problem of where price can be. As each planetary impulse strikes our ionosphere, it generates two waves, traveling in opposite directions around the earth. These overlapping waves are the cause of inversions, and the two MoonTides. These waves can be translated to degrees on the circle, with each degree being so many dollars. But if prices go over the amount per circle, they start another circle. The S&P has $72 per circle. So a degree position of 90 degrees can be $18, $18+$72, 18+72+72, etc. Any one is a valid solution.
And prices can move from one circle to another-directly, though a mathematical "worm hole."
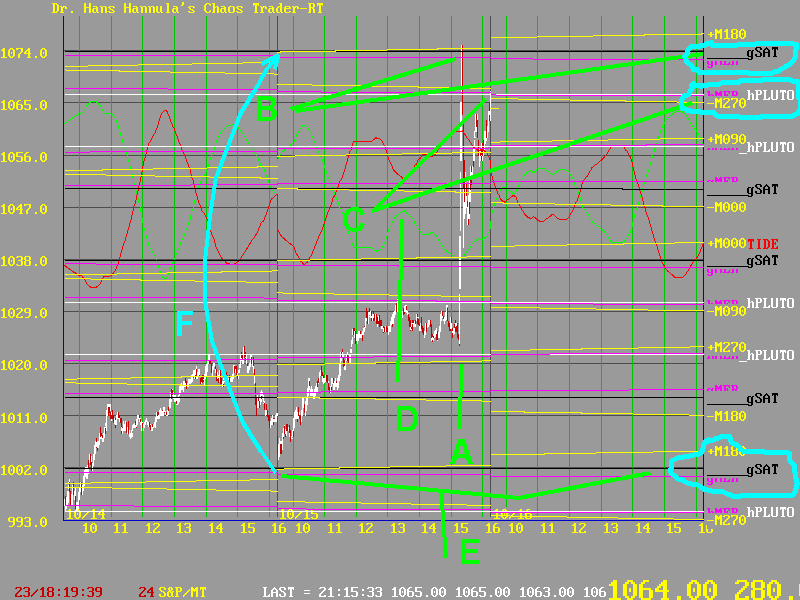
This is what happened when the Fed cut the rate. This chart shows the
result.
The essence of chaos is balance- when the strong forces are balanced, a small force can tip the balance, sending energy in an avalanche. At the critical CHAOS BALANCE points in the energy fields, human action can tip the balance. That is why ASTROCYCLES DO NOT PRE-DESTINE things. They provide the energy, but at the key points, we can choose the direction.
At A, the cut was announced. A 1/4 point cut is reality is nothing-not worth such a reaction. But the cut came as the Exchange lined up with the Quarter Moon, Mercury (Satan) and Pluto (explosions). Prices moved in minutes to point B. This level was set by the Moon+180 flux line, and geo Mercury and Saturn electric field flux lines. The close was at a price set by helio Mercury and helio Pluto, shown at C.
The MoonTides had switched from the -MoonTide in the morning, to the +MoonTide (green) in the afternoon. C shows the 1:20 high. At A, the low was in the +MoonTide, and the high was in the -MoonTide. Talk about chaos! Any system that has two or more solutions is chaotic, and markets are are provably chaotic.
From the opening near 1002 at E, set by geo Mercury and geo Saturn, to the high at 1074, also set by geo Mercury and geo Saturn, the market moved a full circle of 72 points. So while chaotic systems are not completely predictable, a lot can be said about them if one understands how they work.
A final point. I had a call today from someone who wanted to trade the S&P from the TV set - without a live data feed. How can one hope to compete? One move like this against you and your capital is gone.
I give myself 60 seconds to call in a protective stop when an entry stop is
hit. Today shows you why. The markets are chaotic-they can and will
catch you off guard. So if you insist on trading them -
1. Learn how they work
2. Protect yourself always.
Isn't it amazing how the Moon and Friends can bring us such nice, orderly Chaos?
![]()
![]()