
March 4th, 1999

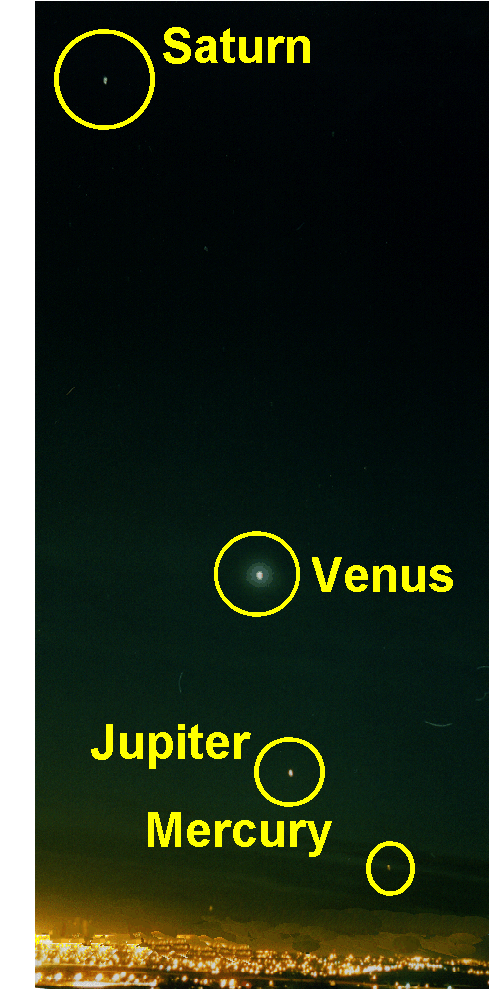
There is a wonderful sight in the evening sky. This is the view looking to the west, in beautiful Denver. This is a view that comes only once every twenty years (Jupiter-Saturn). The Mercury-Venus cycle is about 144 days. All that Gann talk about the square of 12 is code for Mercury-Venus. Anyway, this sight brought me great wonder and awe.
Then I turned around to face east, and here is what I saw.

So how does all this fit together? As you know, I am scientifically establishing that physical events move markets, working through the earth's electric field, and following the laws of chaotic systems.
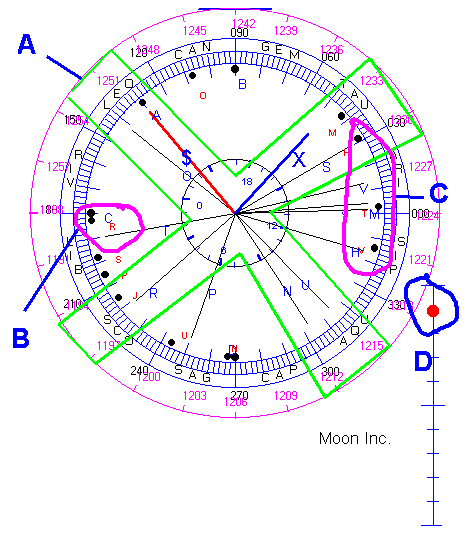
First, look at the ephemeris wheel for today, shown below.

The wheel shows a huge Double Grand Cross at A. We have the big Saturn-Neptune-Mars-Moon's Node square. Saturn is parked on the S&P natal sun. Then we are forming A Mars-Uranus-Venus+Mercury+Saturn-Node square.
The fact that the market is responding to this pattern is shown by the red $ line, which is price. The blue X line is the time of the close today. Over the next few weeks, you can go out in the evening and watch as Mercury and Venus climb up to Saturn and complete the square.
At B you can see the Moon transiting natal Mars, headed toward current Mars. More on Mars later.
The pattern from the first photograh is shown at C. Imagine standing in the center of the wheel looking left. H, the sun, is below the horizon, so it is after sunset. Then one can move up, and see Mercury, Venus, Jupiter, and Saturn.
Also, note that the moon is nearing maximum inclination. That often sets the final day of a move.
One would expect a market reaction. But what kind?

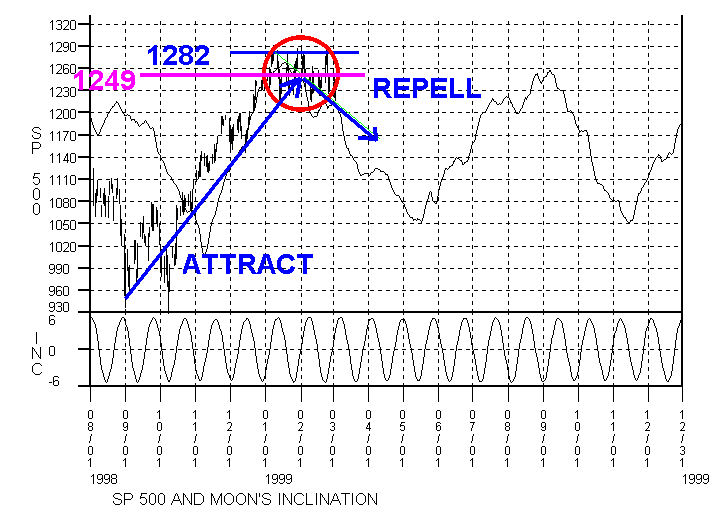
This chart shows my annual forecast. It is based on a 92 day Zero-Delay filter of the S&P XGO energy. 92 days is 1/4 the year, so matches the square patterns.
The chart shows the 1282 level of the S&P Natal Node. It continues to be resistance. The 1249 level is set by the Saturn-Neptune point. On January 24th, the Earth opposed Neptune, becoming part of the square pattern. This has formed a huge Fireball, as shown in red. This is a chaotic "strange attractor/strange repellor."
The chart shows the moon's inclination as well. The major highs and lows are near the dates when the moon is at it's extreme pitch in its orbit.
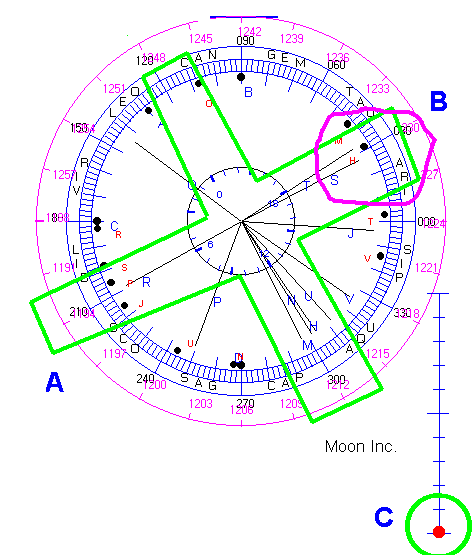
Here's the ephemeris wheels for January 24, 1999.

The square is again clear, along with the Moon at Saturn, and a big meeting of planets at Neptune. This was the tightest part of the pattern, which is now evolving. As the pattern separates, it begins repelling prices. With so many cycles, there is a lot of whipping up and down. That's why it you feel so beat up right now. These periods feel chaotic, and one must understand the big picture not to get caught up in the whips. As the moon came passed natal Mars, my wife mentioned that people were nasty and irratible. That fits. Now comes current Mars.
The pattern is about complete, and the market will soon establish a trend. I think the trend is down. If the highs fall, I am wrong. So keep watching the evening sky, and watch the cause and effect of the heavens on things down here.