
Feb 17, 2000
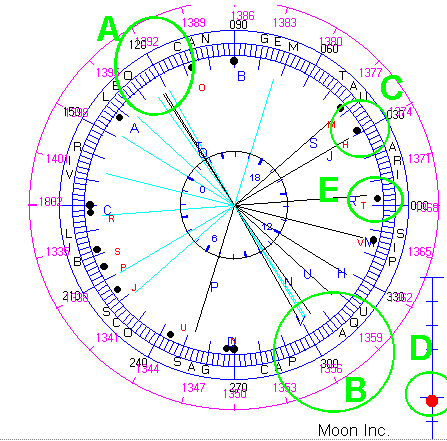
The event was very clear in the ephemeris, shown below.

The Moon, lining up with its Node, is at A. Opposite it is Venus, lining up with Neptune. Very sharp alignment just after the market open.
Other features of the pattern:
C. All 4 square Jupiter and Saturn - the key feature in the night sky.
And Jupiter is transiting the S&P natal Sun while Saturn is transiting
natal Mercury.
D. The Moon is on the ecliptic plane-giving maximum effect.
E. Mars transiting the S&P natal Moon-making the Moon "hot."
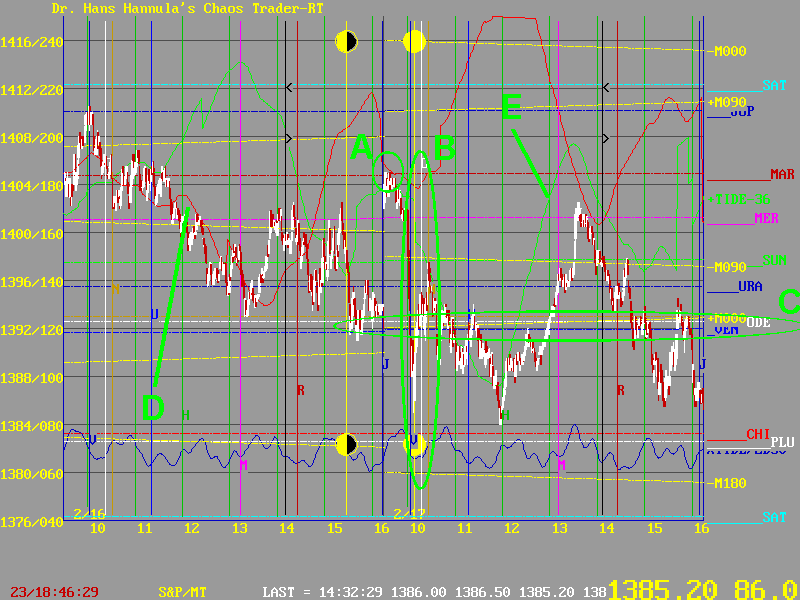
So did it show up in the market? Of course. Physics works.

The market opened at A, on a Mars electric field flux line - 180 degrees to the Mars/natal Moon point.
As the earth rotated the Exchange into the Moon, Node, Venus, Neptune cluster at B, the market plunged, then soared. All the "vibration" was about the Moon, Node, Venus, Neptune flux lines at C.
The market followed the -MoonTide at D yesterday. Today it followed the +MoonTide shifted left 36 minutes. The afternoon high came on the Mercury flux line- Saturn transiting natal Mercury.
It's all physics. I use only the physics and the date of first trade to compute the MoonTides - no price data. So the physics are real, visible, and important. And if you are going to trade the markets, it helps to understand them. You have to Learn to Earn.