
Jun 1, 2000
Last week I indicated that the big fireball would repell prices, probably upward. Part of that analysis was based on the knowledge that the New Moon would be "entering" the market.
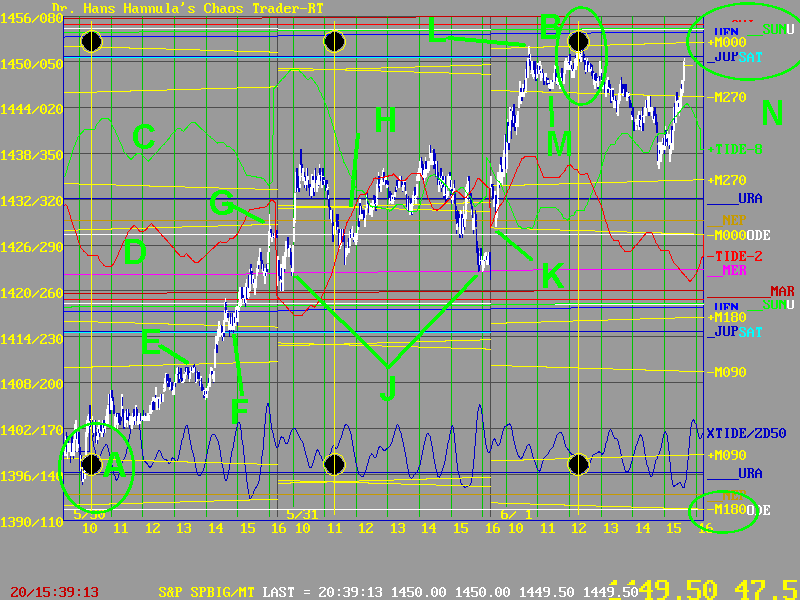
The effect of the new Moon "in the market" is dramatically illustrated by the three day chart below.

On Tuesday, the market opened gap up at A, on the -M180 Moon electric field flux line. The intersection of that line and the New Moon overhead the Exchange formed a Strange Attractor/Strange Repellor. Prices blasted in a fairly straight line to B, where the New Moon and the +M000 Moon electric field flux line again formed a SA/SR.
During these three days, the MoonTides, at C and D, indicated the turns during the day. Note that most of these intraday turns were quite accurate.
In the path from A to B, prices were affected by several Moon electric flux lines, shown in yellow. Note the price reactions on Tueday at E, F, and G.
On Wednesday, the Moon flux lines crossed during the day, effectively canceling each other. This let Mercury, at J, set the lows, and the Moon flux lines served as an average level.
On Thursday, prices did a beautiful "band gap energy jump" from the -M000 flux line at L to the +M000 flux line at M. Then prices retested the high at the New Moon and +M000 at B. They closed almost on the +M000 flux line.
After that, prices sagged until the late rally brought them back up toward the +M000 flux line, which is clustered with the electric field flux lines of Jupiter, Saturn, Mars, Sun, Venus, Chiron, and Pluto at N.
I think this is only part of a larger rally. My Hand of God forecast is up for several weeks. But there are pullbacks. They will come as the Moon changes phases. But for now, just appreciate that the New Moon can be an awesome force in the S&P!
All those flux lines come from waves in the earth's electric field. I've spent years modeling them, learning to compute them, and learning to trade them. It's all about gaining a trading edge.