

February 25, 1999
There is a direct connection between what one sees in the skies, and what happens in the markets. The events of the past few days illustrate this clearly. One only has to make careful, scientific observations to verify what I say. By carefully watching my environment, I was prepared for the Money from Heaven that the Universe made available to all on February 24th.
Preparation began the evening of the 23rd. For several nights the local TV station had been showing the spectacular conjunction of Jupiter and Venus in the evening sky. When they announced that the pair would be as close as they would get the night of the 23rd, I got out my telescope and camera. From my neighborhood park I took these pictures.
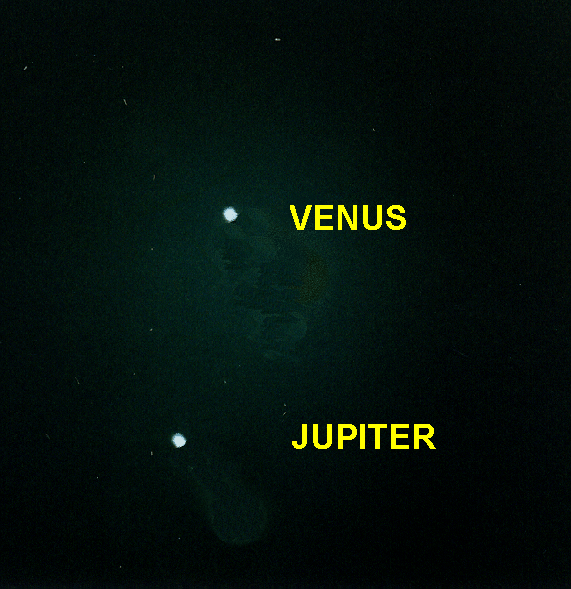

The quarter moon had a halo around it, which is barely visible in this photo. But one can see the high thin clouds casting a translucent veil over the quarter moon. So I saw the signs, and I knew what they meant. Just like the Bible says.
I knew that there was a cause and effect relationship at work, so I was alert for a change in trend at the time the Exchange passed the quarter moon, and then Venus and Jupiter a few minutes later. In simple terms, this is the market action on February 24th that resulted from the signs I say in the sky the night before.
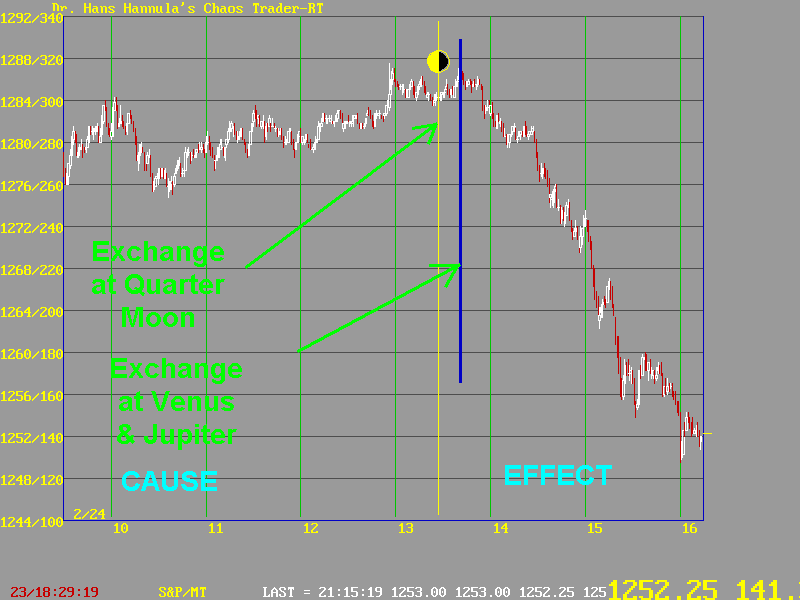
This market behavior is caused by the chaotic system at work. The emotional part of market behavior is caused by waves in the Earth's electric field. These waves are generated by the sun, moon, and the planets. They cause surges in the electric current flowing through traders, and they react emotionally.
These electric waves occur in pairs-a positive and a negative wave. At certain price and time points, the electric fields exactly cancel, forming what mathematicians call a "singularity." These points, in the words used by chaologists, are "Strange Attractors/Strange Repellors." Prices tend to be attracted to a strange attractor. When they get close, the attractor may act like a hot stove, causing prices to skirt around the attractor. Then, after prices pass the attractor, it becomes a repellor, pushing prices away from it. This chart shows that behavior.

The "hot stove" is shown by the red circle. I call it a Fireball. When I saw the spike up on the right side, I recognized the fireball. I knew that the Exchange was passing Venus and Jupiter. I covered my longs, and put a sell stop at 1282. I covered on the close at 1251.75, for a nice 30.25 points per contract. I don't always trade that well, but in this case, having seen the signs and knowing what to look for, I did. I thank God for that.
That all sounds simple, and it is. But to get to the point where I can observe the markets and see what is happening, I use my own custom software called ChaosTraderRT (for realtime). It lets me put a lot of information on the screen. Over the years, as I have discovered phenomena, I have added code to Chaos Trader to display that phenomena. The chart below shows the same two days of market action, but with a lot of detail.
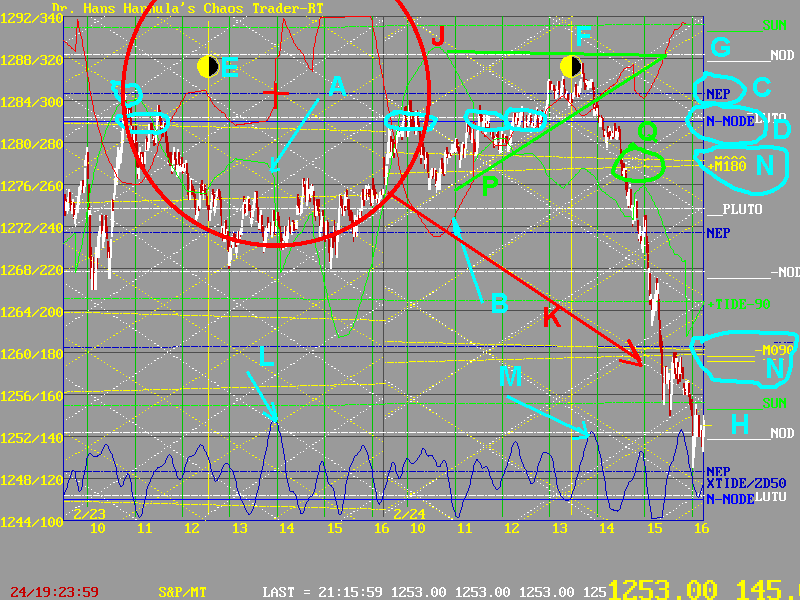
Briefly, here is what each item shows-
A. the +MoonTide(green).Market basically followed it.
B. the -MoonTide(red).Market followed morning of 24th.
C. Neptune electric field flux line. Part of major Neptune-Saturn square.
D. S&P natal node line. Fourth retest this year. Four tests here.
Gann's rule of four says to expect a panic. That's the same as expecting chaos.
I told you THE NODE KNOWS.
E. &F. Quarter Moon at Exchange. Low on 23rd, high on 24th.
G. the current Node electric flux line. The left side of the fireball was
formed when Mercury squared the current Node. So the Devil was there, too.
H. another Node electric flux line. Set the close. Told me where to cover.
J. Big fireball of the 23rd. The Effect was held up one day by
Venus/Jupiter.
K. Fireball blast. Followed rotating earth and moon harmonic flux lines.
L. XTIDE energy spike due to Venus and Jupiter. Set center of Fireball.
M. Venus/Jupiter XTIDE spike. Set the final high. Told me when to go short.
N. Closely spaced Moon flux lines. Big moves can occur under this
condition.
P. Converging triangle formed by Node lines on top, and rotating earth/moon
harmonic flux lines. Formed a nice trend line under the morning rally. This is
where triangles come from.
Q. a tiny diamond where the flat Moon flux lines cross the diagonal ones.
Often areas of great volatility.
That's almost too much for a human to watch, let alone watch and think and trade. So I don't always turn on all this stuff. But when one wants to understand why a move occurred when it did, it is all necessary.
A simpler view is often possible, if one just looks for the fractal patterns. This chart shows the unclassified version of the Hannula Market Fractal/Fractal of Pi. It is called the Chaos Clamshell(CC). Shown at A, it has the arguable 7 moves.
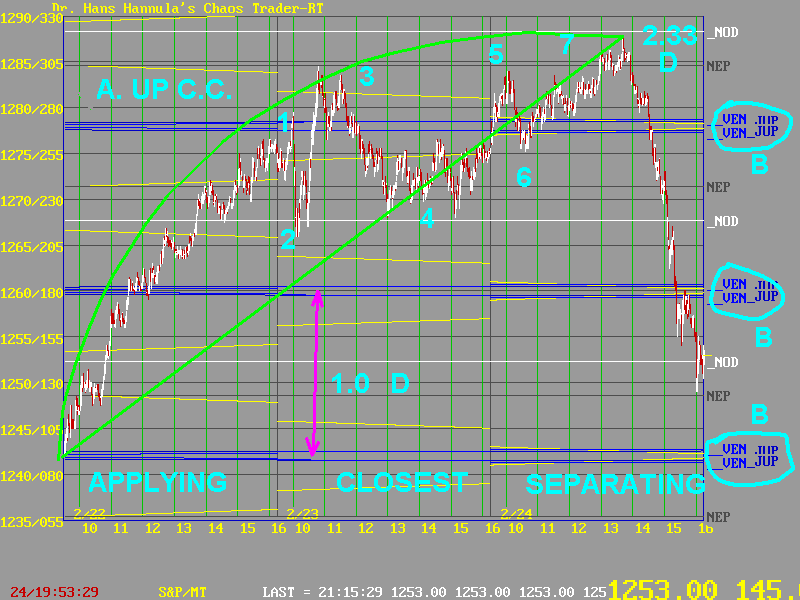
This chart also shows more about the Venus and Jupiter driving force. The move started on the Venus and Jupiter flux lines (B) on the 22nd, at 1242. The conjunction was applying. Each day shows how the conjunction progressed.
One can see the "quantums" set by the Venus/Jupiter flux lines at 1260 and 1278. Note the price reactions at these prices.
The spacing between them can be taken as a unit of 1. The fractal height was 2.33 times this unit of 1. This is a significant number in Chaos theory, being half of the Fiegenbaum constant of 4.666. It shows up in markets very often.
Of course, I was also watching my MoonTides. The current version of the MoonTide software allows me to smooth MoonTides with a Zero Delay filter. This gives me a 6 to 8 day cycle. I call that filtered MoonTide MTZD6. If one can fit it to the current price action, one can often get a good forecast for a move lasting a day or two. Recently, I have been working on a version of the MoonTide software that adds in the Face of God pattern. If one can find an agreement between the two, one can be more confident of a move. On the 24th, I was using the program and found the alignment shown below. I even managed to email it to my TOMORROW'S MARKET EMAIL clients. That wasn't easy to do while watching Chaos Trader and trading. So I can't always do it.
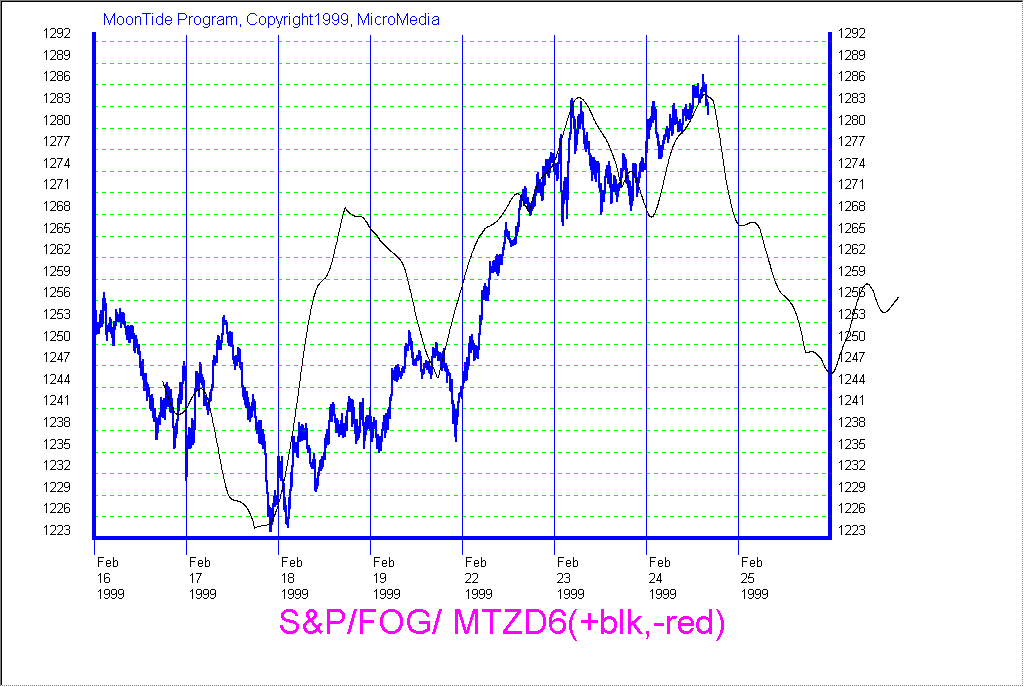
That was the MTZD6 forecast. Here is the result.
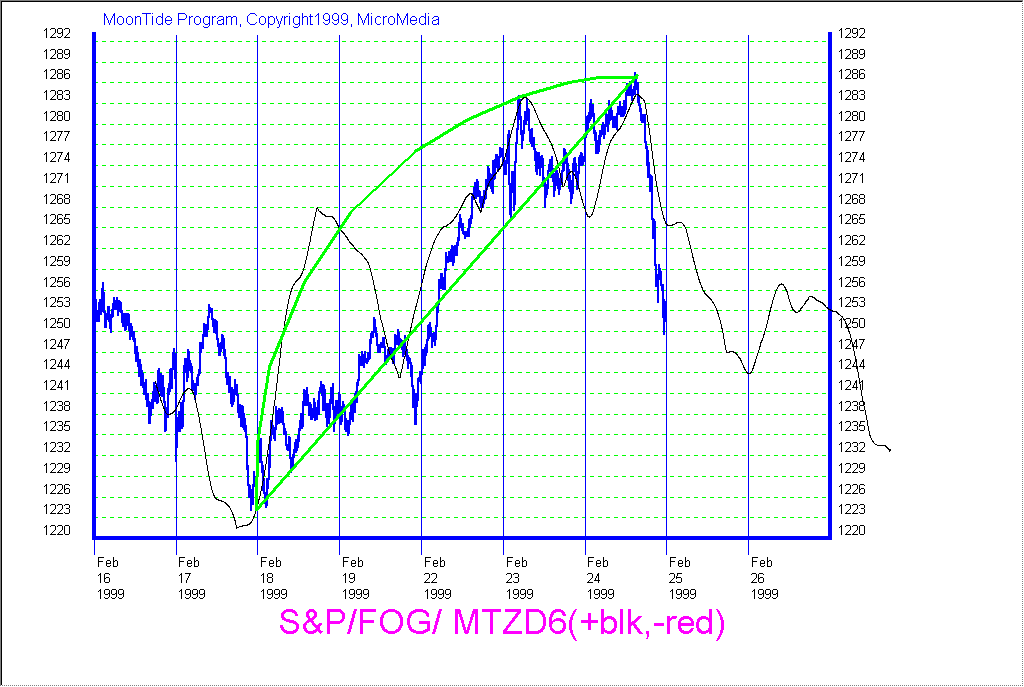
It is hard to believe that there is so much going on in the market on just a few days. But several things are clear. There IS a connection between what one sees in the sky, and what happens in the market. There IS a growing body of knowledge about how these things work. I am getting better and better every day. And I keep working to share that knowledge with others. So if you want to avail yourself of this knowledge, you can. If you learn it well, you too can collect some of that real nice Chaos Cash.