
May 4, 2000
Well, the date is off. I wrote about it in my February newsletter. I pointed out that the real energy point would be 4/3/2000, when the Moon joined the pattern. The Moon is the fine timer.
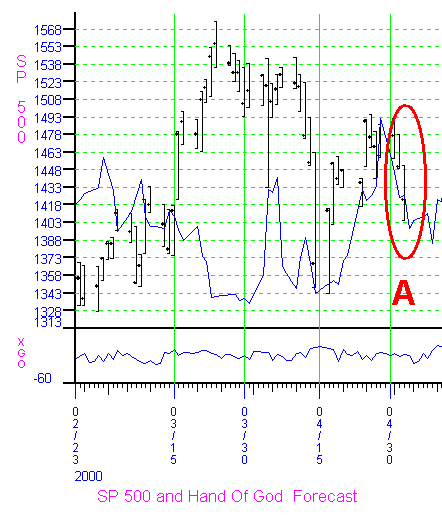
I was expecting a drop, based on my Hand of God Forecast below.

The forecast called for a turn at the end of April. It was a choppy turn, with wide ranging days. But then it turned sharply as shown at A. (The Hand of God Forecast is periodically added to our CHAOS TRADER'S HOTLINE for position traders.)
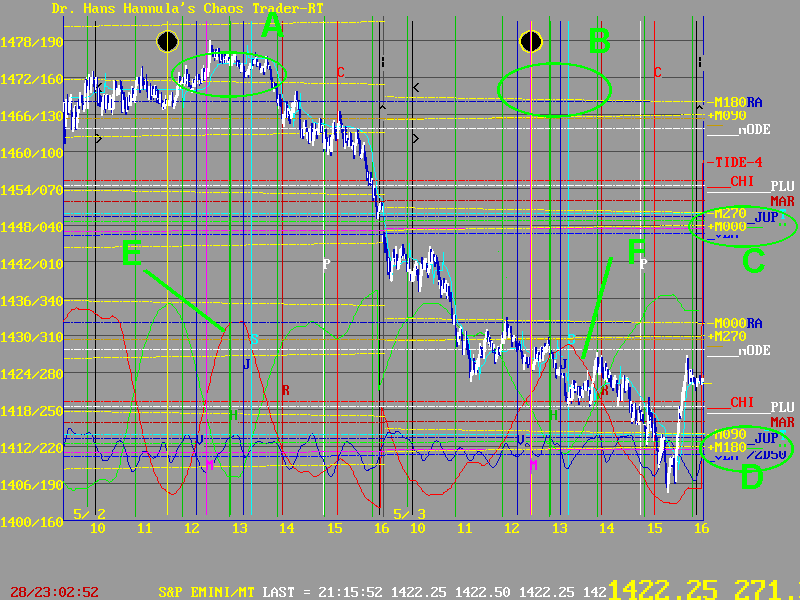
This chart shows the S&P 500 for May 2nd and 3rd.

The points where the Harmonic Convergence lines up with the Exchange are shown at A and B. On the 2nd, the New Moon was "applying" to this pattern. On the 3rd, it was in the pattern, exactly aligned with Mercury.
The price levels set by this convergence are marked at C and D. You can see that they attracted prices near the close of each day.
The market followed the red -MoonTide line (E) on the 2nd. On the 3rd, it started out following the green +MoonTide, but inverted as it passed the Moon and Mercury. It then followed the red -MoonTide at F.
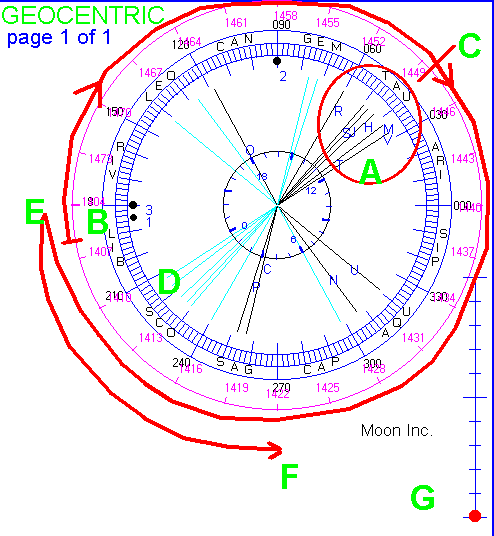
The decline is also shown on the Wheel of Fortune below.

The Harmonic Convergence is shown at A. The price high on the second was at B, at the the cardinal 180 degree point on the wheel. They followed the red arrow around to close at C on the 2nd, at the Convergence.
On the 3rd, they declined to oppose the Convergence at D, then dipped briefly to the 180 degree point at E, and rallied to F, the 270 degree point. Pretty neat harmonics - all cardinal points and the Convergence.
The Moon was extra effective, since it was at maximum southern inclination, at G.
Notice that the Harmonic Convergence averages to about 45 degrees. From the high to the Convergence is 3/8 of a circle-a Fibonacci ratio. From the Convergence to the low is 5/8 of a cirlce, another Fibonacci ratio. The late rebound was 1/4 a cirlce.The range of the decline was a full circle. Nice.
So, you see, this drop was all energy harmonics and physics.