
|
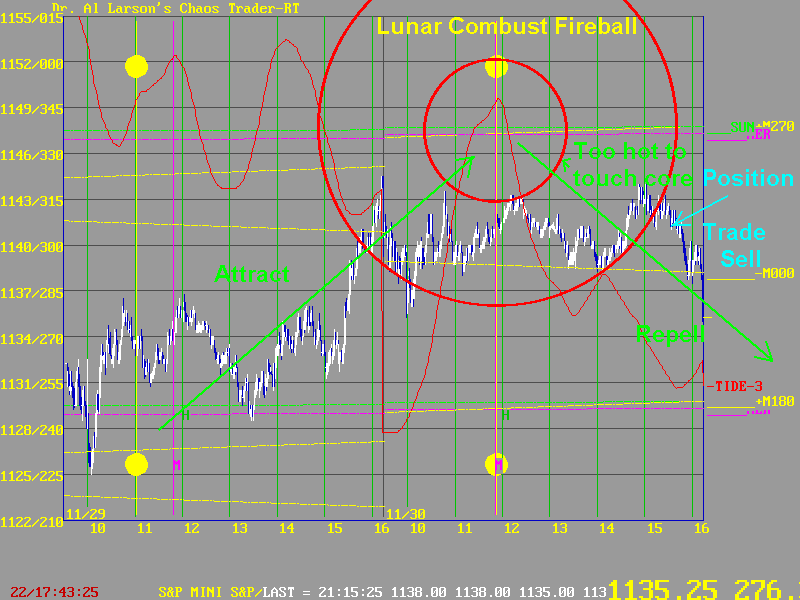
Written December 6th, 2001 After last week's see-saw market, I did a page showing how the coming Lunar Combust was showing up in the market action. This update shows what happened last Friday and the first four days this week.

Last friday, I thought the market might rally to a sharp peak near 1149.5 at noon, as per the red -MoonTide. While the market attempted to rally, it was constantly beaten back. As the day came to a close, I realized that the 1149.5/noon point was the center of a chaotic Strange Attractor/Repellor. It was acting like a hot stove. Prices could not touch it, yet they could feel the heat. Seeing this, I did a late sell as a position trade at 1141. I figured if prices could not touch the Mercury/ Sun + 90 degree point, that they would drop to the 1131.5 price of the actual event.
This next chart shows the first 4 days of this week.
On Monday prices opened at the 1131.5 price of the event. The flux lines are shown at A. But I was nervous, so I covered my short at 1134. Nice 7 points. For the rest of Monday and most of Tuesday the market vibrated about the Combust price level. Late on Tuesday, it made a drop, and I again sold, at 1128. On Tuesday, prices had not dropped overnight. Instead they held up, but were not going anywhere. I was getting very nervous about my short. Unforuntately, I was distracted in the office, so I didn't kill the unproductive short when I should have. I did check as the Exchange passed the Sun/Mercury Combust at B. Looked OK. I knew that the exact time of the Combust was 4:22, just after the close. I knew that at that time, with the Full Moon near the close, that prices WOULD move. I, of course, assumed prices would move down. After all, the trend of the past week was down. So when prices started to rally after point C, I realized I was WRONG. I immediately covered my short at 1137, giving back 2 more points than I had claimed on the prior short. Because I was frustrated, and distracted in the office, I did not reverse to long. Even though I knew Combust as moving the market, I realized I was menatlly BEHIND THE MARKET, not ahead of it. So I passed on any more trading. Over the long run, that has been a good strategy. After that, I just enjoyed the beauty of watching the Lunar Combust in action. From C, prices rallied swiftly to D, closing at the 1149.5 "price squares time" point. In a trend, that point would normally mark a turn. But in this case, we had a "conjunction resonator." Conjunction resonators are completly described in my book, Your Electric Live (see the eStore). In that phenomena, energy squirts though to the "price opposes time" point, and reverses the trend. So on Wednesday, prices opened at D and kept moving to the 1167.5 price level, set by the Combust event, plus 180 degrees. This level is marked at E. It was reached as the Exchange again rotated past the Sun and Mercury. The quarter Moon at G added energy for this fast move. After point E, prices began vibrating about the new Combust Quantum. There was a brief rally Wednesday after noon, which I did trade for 3.5 points. I was back mentally ahead of the market. But prices fell back to the Combust Quantum. And they just vibrated about it all day Thursday. So prices simply made a 180 degree move, from the physical Combust point, to a position opposed to it. Notice the "S" shape of prices. The 2 days after the Lunar Combust are the inverted mirror image of the 2 days before. Nature loves symmetry. This is one of the best examples I have documented on how the markets are affected by the planets, as they manipulate the electric fields, which in turn manipulate traders. This time I didn't capture all the profits I should have, but I did come out ahead. And next time, I'll plan ahead better. Say, do you know when the next Combust is? Hint: You can find out with The Trader's Ephemeris or WinGephi.
|