
Sep 16, 1999
Last week, I was asked about the electric field flux lines. Are they dependent on price? Where do they come from? Do they work in stocks?
First, the electric field flux lines are totally physical. They are part of the earth's electric field. They have been there since the dawn of time. So they are independent of price.
Prices react to these lines as leaves to the wind. The flux lines represent electrical currents. These currents flow through traders, affecting their emotions(see Why Johnny Can't Trade in the Reading Room). This emotional buying and selling shows up in prices. Then, when the prices are plotted on top of the background of flux lines, they appear to form support and resistance lines. When multiple fields overlap, they add together to form "strange attractors/repellors."
How many sets of flux lines are there?
There are two fields (a positive and a negative)for each planet, the moon, the moon's node, and the rotating earth. That's 24 overlapping electric fields working at once. ( No one said this was a simple system.) The trick in using the flux lines is to concentrate on a few at a time.
This was again demonstrated in the S&P this week. Mars (war) was conjoining Pluto (nuclear) and the Moon. The effects are shown below.
This strong conjunction set a price point of 1344, +/- multiples of 18 points ( or 90 degrees). These levels are shown as the quantum levels at A,B,C, and D.
Prices started a decline at E, just after the Mars - Pluto conjunction. At E, prices were square (90 degrees) to time, as measured by the conjunction. That made 1344 a strange attractor.
Prices dropped and vibrated about 1344 as shown at F. This vibration was bounded by an ellipse. That inicated another field at work as well. This one was Mercury, which was transiting the Chaos Balance point of 180 degrees, or 1322. So the top of the ellipse was a point at which price again squared time, here, measured by Mercury. And it made 1332 another "strange attractor." And that's where prices closed on the 15th.
On the 16th, prices congested again near the Mars/Pluto/Moon flux lines at G. They then dropped to the Mercury flux line at H as the Exchange passed the Quarter Moon, or squared the Moon. Prices were then again square Mercury, this time 90 degrees below it.
Prices changed dramatically as the Exchange passed the Quarter Moon. They rebounded back up to close on the Mercury flux line at K, pausing on the way to congest at the Mars/Pluto/Moon flux lines at J.
So the effects of the flux lines are very clear. An they can be a very useful trading tool.
Now, do they work in stocks?
Yes, if you can get the scale factor right. The electric field flux lines are measured in degrees, and one must find the proper mapping from degrees to price. Sometimes this is very difficult. But it is worth doing.
Below is a chart of Cisco. It was mapped to the flux lines by expressing price in ticks of 1/16 point.
Now, for a bit of a diversion, but along the same lines. These flux lines are invisible. We can "see" them only through computing their position and watching the effects on prices.
But science is changing that. Our Hubble telescope has taken a set of neat pictures showing the effect of Jupiter's Moon Io on Jupiter's electromagnetic field. The field was made visible by Jupiter's aurora near it's poles. The aurora is caused by the highly charged particles following the electric flux lines. This is just like the aurora on earth. To bad there are no traders on Jupiter. I would be fun to watch prices react to Io manipulating Jupiter's field!
This is the description given by NASA:
PHOTO NO.: STScI-PRC96-32
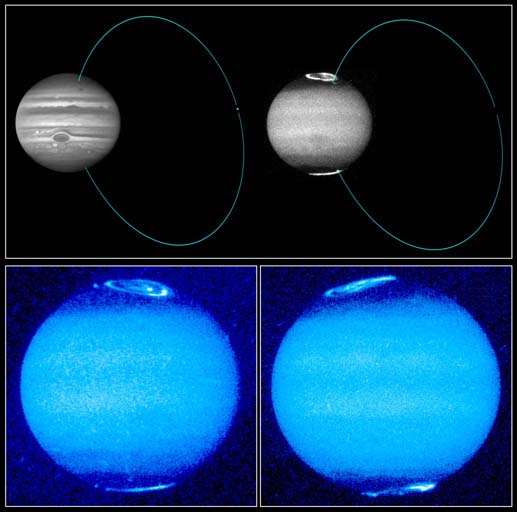
HUBBLE IMAGES REVEAL JUPITER'S AURORAS
These images, taken by the Hubble Space Telescope, reveal changes in Jupiter's auroral emissions and how small auroral spots just outside the emission rings are linked to the planet's volcanic moon, Io. The images represent the most sensitive and sharply-detailed views ever taken of Jovian auroras.
The top panel pinpoints the effects of emissions from Io, which is about the size of Earth's moon. The black-and-white image on the left, taken in visible light, shows how Io and Jupiter are linked by an invisible electrical current of charged particles called a "flux tube." The particles - ejected from Io (the bright spot on Jupiter's right) by volcanic eruptions - flow along Jupiter's magnetic field lines, which thread through Io, to the planet's north and south magnetic poles. This image also shows the belts of clouds surrounding Jupiter as well as the Great Red Spot.
The black-and-white image on the right, taken in ultraviolet light about 15 minutes later, shows Jupiter's auroral emissions at the north and south poles. Just outside these emissions are the auroral spots. Called "footprints," the spots are created when the particles in Io's "flux tube" reach Jupiter's upper atmosphere and interact with hydrogen gas, making it fluoresce. In this image, Io is not observable because it is faint in the ultraviolet.
The two ultraviolet images at the bottom of the picture show how the auroral emissions change in brightness and structure as Jupiter rotates. These false-color images also reveal how the magnetic field is offset from Jupiter's spin axis by 10 to 15 degrees. In the right image, the north auroral emission is rising over the left limb; the south auroral oval is beginning to set. The image on the left, obtained on a different date, shows a full view of the north aurora, with a strong emission inside the main auroral oval.
The images were taken by the telescope's Wide Field and Planetary Camera 2 between May 1994 and September 1995.
Credits: John T. Clarke and Gilda E. Ballester (University of Michigan), John Trauger and Robin Evans (Jet Propulsion Laboratory), and NASA.
For more neat pictures taken by
the Hubble telescope go to:
http://nssdc.gsfc.nasa.gov/photo_gallery/photogallery-jupiter.html#hst-jupiter
![]()
![]()