
JUL 8, 1999
There has been a rising sign this week. It is warning of a probable sharp market drop. This is what it looked like yesterday.


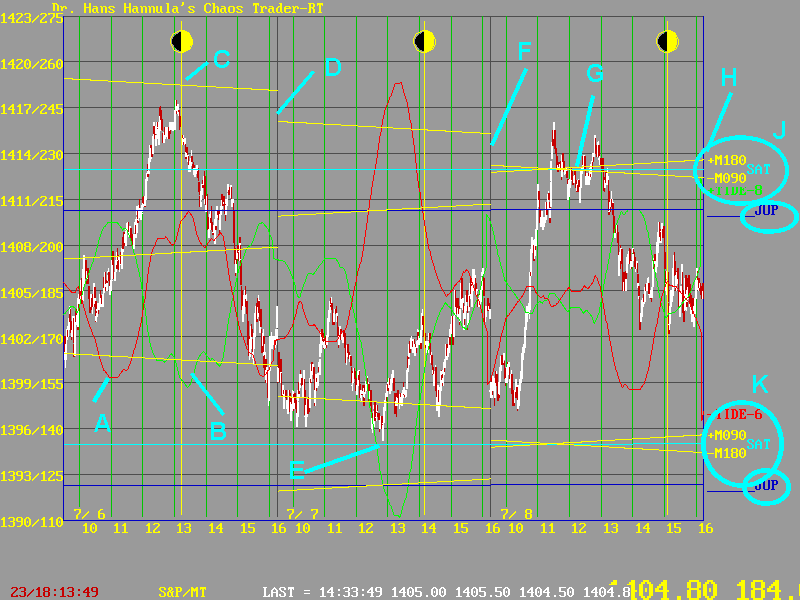
The MoonTides are shown at A and B. The market followed the red -MoonTide on Tuesday and Thursday, and the +MoonTide on Wednesday. This alternating pattern is a clue that something bigger is happening.
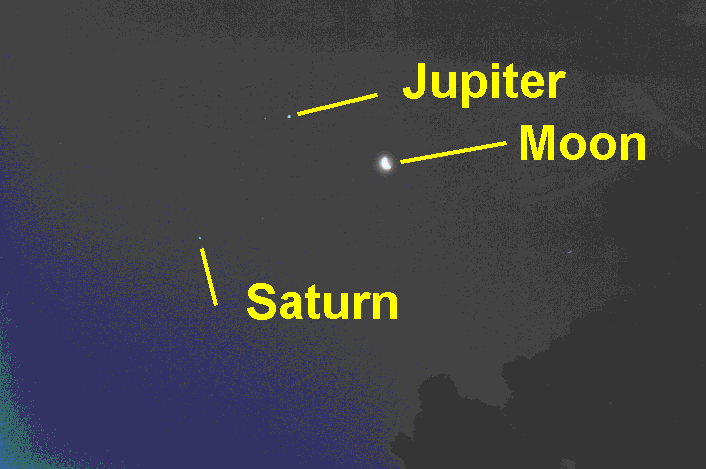
The market peaked at C on Tueday as the Exchange squared the Moon. That shows the Moon is a player in the larger pattern. On Tueday the Moon was about 15 degrees from Jupiter. Before the opening on Wednesday, it conjoined Jupiter as shown in the photo. This is shown at D. Note that prices were depressed.
Note the two price clusters at J and K. They are the quantum levels set by the electric field flux line of the Moon, Jupiter, and Saturn. Note how at E, prices came down to the lower set of flux. This is typical action coming into a pattern.
This morning, at F, the Moon was conjoining Saturn. This made the point at G, where the Moon's electric field flux lines cross over on the Saturn flux line, very "hot." Prices shot right up to the upper pair of flux lines. They could not stay there, and settled to balance mid-way between the quantum levels.
So it is clear that this pattern is affecting the intraday prices-but what about the longer term? Below is a chart from my new Chaos Trader daily chart program.

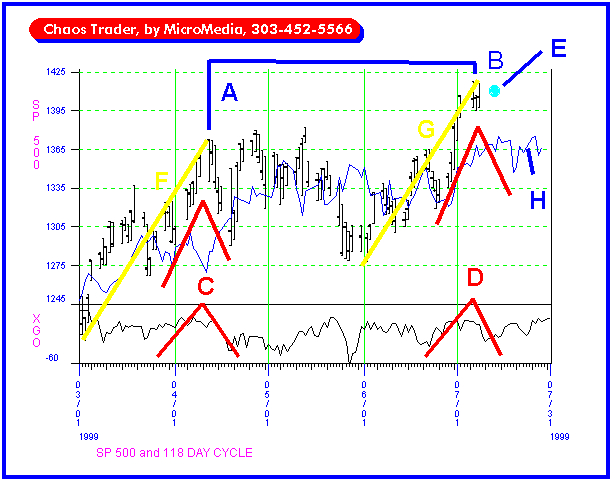
This cycle magnifies lunar patterns that are 118 days apart, so it is good to look back 118 days to see what happened. The blue line shows the point A 118 days ago, and now as B. 118 days ago I wrote about Jupiter Rising. And we had a sharp market drop over the next week.
There are a lot of similarities now. Note the rally, decline peaks shown at C and D. They show up in the SP3.XGO energy function, and were reflected in price. Further, there is a 45 day swing both at F and at G. So the market is showing a very similar response to a very similar physical pattern.
Finally, my Face of God pattern (which can now be done in Chaos Trader) locates a Strange Attractor/Strange Repellor (SA/SR) at the point shown at E. Prices will tend to make a vertical move as time passes the SA/SR.
So do not be surprised if the market suddenly becomes concerned about last week's rate increase. It could happen as early as tomorrow, when the New Moon "enters" the intraday market. Watch for some excitement.