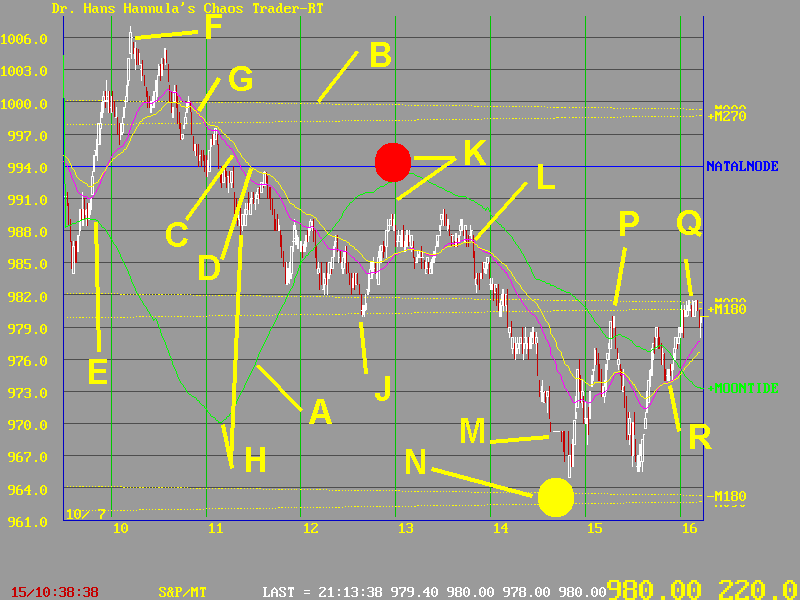

This chart shows the S&P 500 on October 7th, 1998. It shows how the Full Moon worked intraday to continue the Crash of 1998.

The MoonTide forecast is shown by the green line labled A. It forecast an early high, a drop, rally, and a drop.
The Mooon electric flux lines were forming tight clusters as shown by the nearly horizontal yellow lines at B. They set the quantum levels 18 points apart.
Two moving averages for tracking the trend are shown at C and D. The magenta line is my standard 36 minute exponential moving average(EXMA) on the one minute closes. The yellow one is a 55 minute EXMA. Crossings of these two can be taken as trading signal. MoonTides can be used to filter out false signals in this most basic of trading techniques.
The high forecast at E did not come in until F, about 20 minutes late. This suggested the MoonTide might be shifted to the right some. The EXMA's gave a sell at G, confirming that the first drop of the MoonTides was underway.
The forecast low came at H. But because of the suspected right shift in the MoonTide, one could anticipate that the low might only be a minor low. Prices rallied briefly to kiss the EXMA's, and dropped to the Moon electric flux lines at J. That completed the Band Gap Energy jump. Prices made a spike low near 12:36 and jumped up.
That jump was a response to the sun over the Exchange at solar noon. The sun is the Red ball at 1:00 Eastern Daylight Time. See K.
For the next hour, prices conjested. Note how the swings crossed the moving average, and how the moving average went flat. This was a congestion, signaling that the UP forecast by the MoonTides was a weak UP. That suggested that the forecast drop would be strong.
I was busy fixing some software on another machine that day. But when I noticed the nice setup, I slid over to my trading position. When the break came at L, I sold at 983. The moving average crossover gave a sell signal, and the MoonTides forecast a drop.
I also knew that the Full Moon would line up at the exchange at N. so I figured this was a NOON TO MOON swing - a high probability trade.
The market dropped until it hit a "circuit breaker" trading halt at M. When the halt was lifted, prices dropped almost to the Moon flux lines at N. I lowered my stop to 977, just above the 55 minute EXMA. I decided I would sit on that stop in case the market crashed right here. Yes, sometimes I look for the BIG ONE. But here I was doing only after I LOCKED IN A PROFIT.
The BIG ONE didn't come. The bounce to P stopped me out. That's OK. I made money, and I executed my trading rules PERFECTLY.
At R the EXMA's gave a belated buy, and prices closed on the Moon electric filed flux lines at Q. On days where the flux lines bunch tightly like this, the close is nearly always on one of the quantum levels set by the Moon. The close was above where my exit was, so getting out there was just fine. It's all MOoNey in the bank.