
Oct 7, 1999
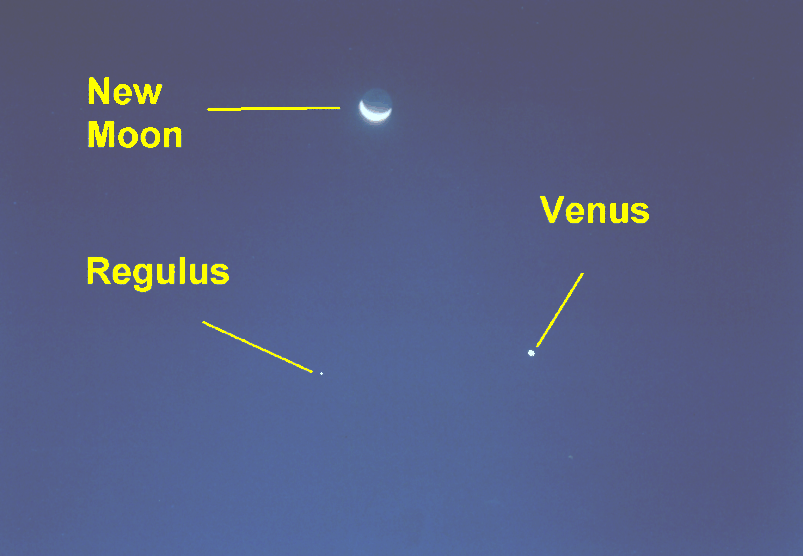
The Bible says that God placed signs in the heavens to warn us of coming events. Over the past year or so, I have been documenting these signs and their effects on markets. This week, the New Moon and Venus make a spectacular rising sign, lined up with the fixed star Regulus.
I have developed a general rule that rising signs (morning) are usually bearsh for the market, and setting signs (evening) bullish. The last sign we had was a setting sign, and we got a rally. So I thought this rising sign might top the rally. And of course, I needed a picture. So at 4:30 AM my trusty pal ACE and I headed for the park to take a picture of this event. We got a good one.
Here is what the sign looked like.


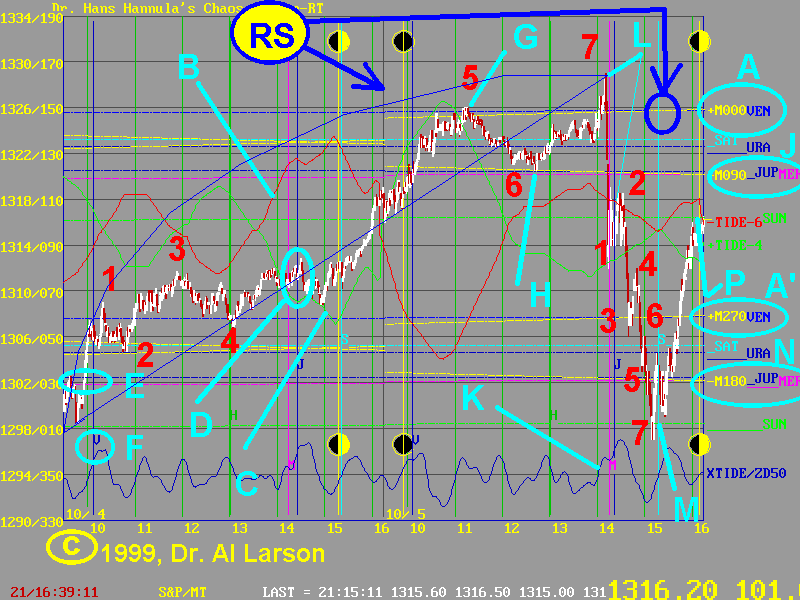
B shows the -MoonTide, followed for most of Monday, and C shows the +MoonTide. Prices switched to the -MoonTide as the Exchange passed Mercury and Jupiter, which were forming an opposition. So I realized that in addition to the Rising Sign, that there were other things happening. There always are, as we are looking at the combined effects of at least 24 overlapping electric fields.
This second factor was also indicated by Monday's open near 1302, set by Jupiter, Mercury, and the -M180 moon flux line, labled at N.
The rising sign was also suggested here, as prices rallied sharply as the Exchange aligned with Venus at F. From that launch point, prices began an up Chaos Clamshell, shown in blue, with red numbers on the 7 moves.
At G, prices had completed a "band gap enery jump" up from the flux cluster at 1305. Here, two hours after the open, prices reached the level of the Rising Sign.
But wait! See that vertical blue line with the V and the vertical yellow line with the black ball? That's where the Exchange passed the Rising Sign. Why wasn't the high there?
There are two reasons- first, the Moontides said the high was later. The MoonTides are a complex calculation, so they capture more complex rules. Second, the Moon had not yet reached Venus. It didn't do so unil the last hour of trading. That's why I show the RS (Rising Sign) symbol with two arrows, one when it rose for the day, and the second for later in the day when the sign completed. So I anticipated that the market might hold up until late in the day.
Now, on Tuesday, the Fed's FOMC was meeting. They were to make an announcement near 2:15 Eastern. Prices anticipated this announcement by bouncing off the -M090,Jupiter,and Mercury flux cluster at H. The cluster is labeled at J. The rally off this bounce was foretold by the XTIDE rally at K.
As the Fed annoucement came out, prices rallied right up into L, where the Exchange passed Mercury. The announcement said that rates would not be changed now, but might be raised later. That was the expected announcement. So why did prices drop 17 points in 2 minutes?
Seems the Fed timing was great-it caught the Rising Sign energy, and the Mercury-Jupiter energy both. Prices dropped like a rock. In doing so, they made 7 very fast moves to M, the Sun flux line. At that point, the entire Up Chaos Clamshell had be retraced.
The low at M came as the Exchange lined up with Saturn, and as the Rising Sign completed. The rally closed on a .618 retracement of the decline, ending on the Sun flux line.
That's what the Rising Sign did. It dropped the market, as expected. But it did not act alone. The Mercury-Jupiter opposition was still forming, still holding prices up temporarily.
The last Venus-Moon Rising sign in September had a similar drop, then bounce behavior. But in a few days, the market slid seriously. It could well do that again. Remember, this is October!