
December 10, 1998
Many times my S&P One-A-Day trade does not work. This trade is defined the evening before, and sent out in TOMORROW'S MARKET EMAIL. It is a totally BLIND trade, to be executed mechanically. That is good for novice traders. But experienced traders can often do better, using the chart included in TOMORROW'S MARKET EMAIL. This chart and the quoted email message shows how one experienced trader made MoONEY from MoonTides on December 8, 1998.

The email I got said:
"Al - your work is terrific !! [ Hans Hannula is a pen name- I answer to both]
I respect your opinion and I think I understand what you are trying to do for you One-A-Day subscribers. Here is how I benefited from your data curves today.
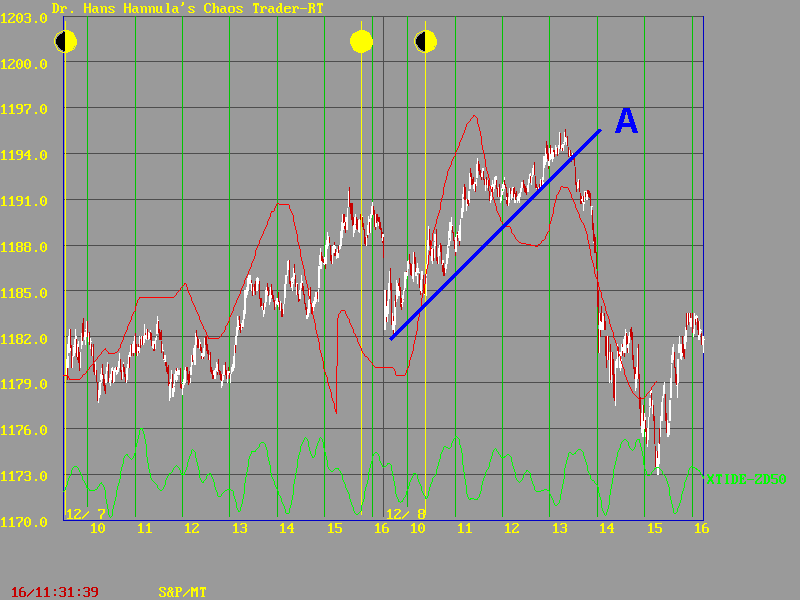
I missed the early move in the e-mini up from the open to 1192-93 but as it was progressing I kept a trend line underneath. [shown at A] At about 10:30 it was obvious to me that prices were following, in fact laying on top of, the -MOONTIDE curve moved backward in time (to the left) . The upward sloping trend line was penetrated at about 11:00 but prices moved horizontally and then up again to form the second top at 12:15-12:30. Wow !! Both tops matched perfectly the -MOONTIDE curve displaced to the left 1 hour exactly.
I don't have nerves of steel - sure don't. But if prices continue following the curve I'm on it.
I waited for a drop below 1190.75, the low of the horizontal movement and then for a fractal to form after going below that price. It came with a low at 1190.00 and in went my stop order for a sell at 1189.00, 1 pt below the fractal. I covered at 1178.25.
Without your studies and daily plots I may not have caught that move - certainly not with the confidence that I had placing that sell order.
Keep up the outstanding work.
LS "
That particular day the One-A-Day trade was not even elected. And I did not trade because I knew I wasn't mentally sharp. So it's satisfying to know that others still use the MoonTides well. Nicely done, LS. I appreciate the nice comments.
LS made great use of the information available to him. One can always see a lot if one watches the market closely. This next chart shows some additional pieces of information.

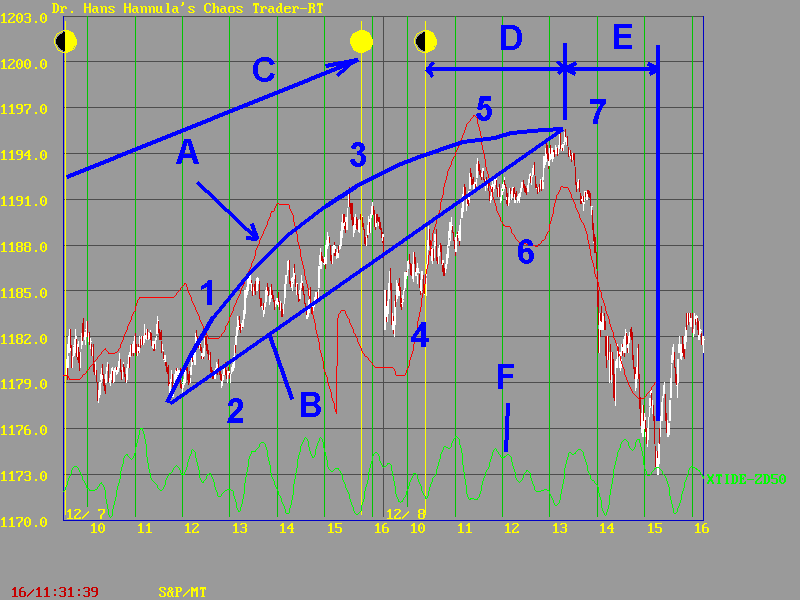
The red line at A is the -MoonTide.
B shows an UP Chaos Clamshell of about 8 trading hours. It has the 7 nominal moves of this pattern. Cash In On Chaos students and Fractal of Pi students should be able to recognize this pattern.
C shows a Moon-to-Moon move, from the Quarter moon to the Full Moon. This is one common pattern when the exchange lines up with two of the 90 degree aspects to the Moon during trading hours. Note that the Full Moon (solid yellow ball) has "left the market" on the 8th. The market worked higher while the full Moon was "in the market." Then it dropped when the full Moon "left the market" on the 8th.
The intervals marked at D and E are exactly 3 hours ( 1/8th day) and 2 hours (1/12 day). These are harmonics of the day working off the point where the Exchange squared the Moon. Very often, on a big move, the timing harmonics will be exact multiples of an hour. In this case, the low, the optimum cover time, was exactly 5 hours from the Quarter Moon and 2 hours from the high.
Finally, F shows an improvement in SP.IXGO, which I call XTIDE. It is processed with a 50 minute Zero Delay filter, so it gets labled XTIDE-ZD50. It captures the tides in the electric field set up by the Exchange rotating. This is work in progress, but is looking good. Note how it gets many of the short swing highs and lows during the day.
Of course, this chaotic day had an underlying order. That order is very clear from the next chart, which shows the electric field flux lines.

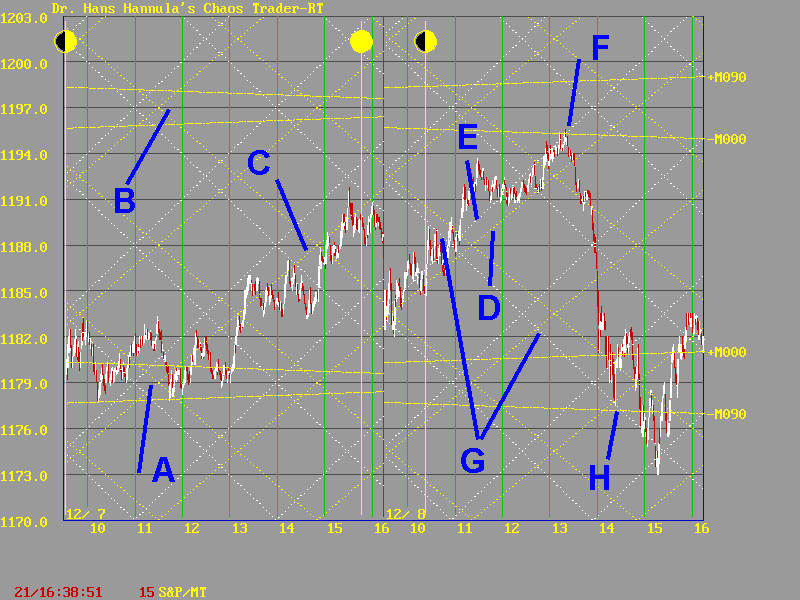
The range was set by the pairs of yellow Moon electric field flux lines shown at A and B. The top pair is the -M000 and +M090 lines and the bottom pair are the +M000 and -M090 lines. Note how they crossed overnight. That often warns of a change of the 6 to 8 day trend.
The morning of the 7th, prices were trapped near 179 until they were carried higher by the yellow line C. This is the 24th harmonic Moon flux line. On the 8th, the rally continued up this harmonic, shown by the line D. The white line E is the rotating exchange.
When the downward -M000 flux line hit this Exchange flux line, the chaotic drop began. Prices completed a "band gap energy jump" at H. This point is where the downward Exchange flux line at G crosses the -M090 line. After that prices vibrated about the lower pair of Moon flux lines.
One can see these electric fields very clearly here. Usually, I see them as they occur, but on the 8th, I wasn't sharp enough. I just wasn't feeling that good, so I stayed out of the market and just watched. Trading the S&P is the toughest game in the world, so one should only play when ready. That's part of a trader's discipline.
So on this day, LS gained some money, and even though I missed the trade, I gained information. That's why one never loses by not trading. And that's why I have the rule that I never chase a trade. If I didn't see it, I didn't see it. There is always another trade coming. MoonTides will even tell me when. So when I get an email like this telling me how a client Cashed In On Chaos on a trade I missed, I celebrate. I know that there is another MoneyTide coming.