
January 25, 2001
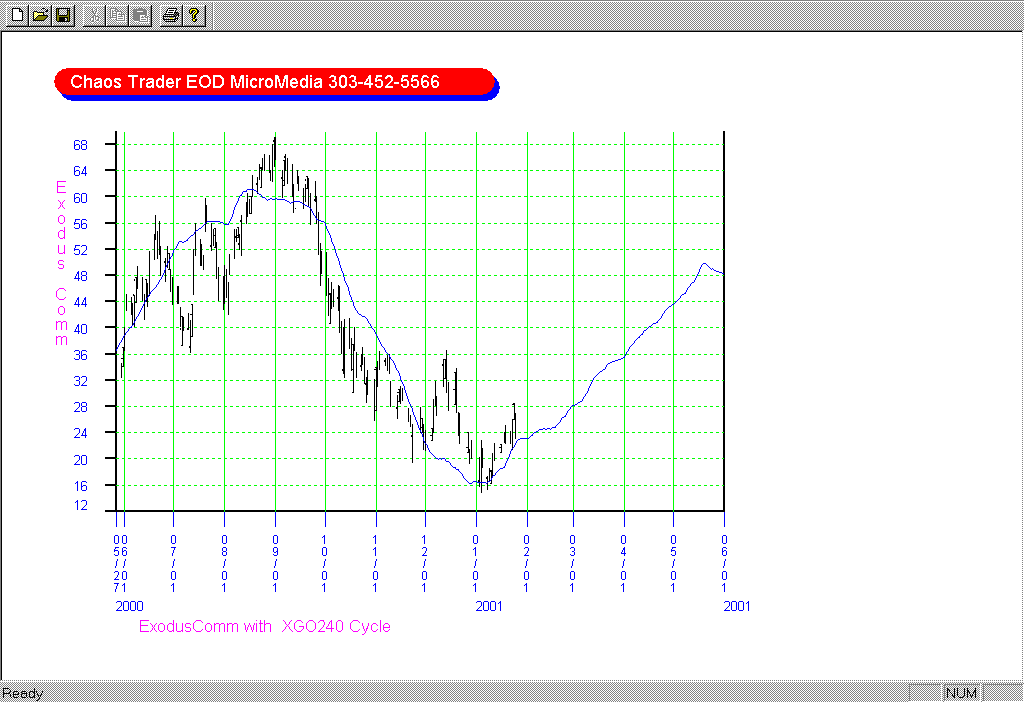
Last week I wrote about a new method for finding longer term energy waves in Exodus. That new discovery is working out so well, I have decided to do a series on these longer term cycles, similar to the series on the Moon In Action. Since we are converting energy into money, this will be a MONEY TIDES IN ACTION SERIES. I'm counting the Exodus page as the first in the series, so this is number 2.
Here is the update on Exodus. It bottomed where we forecast, and rallied nicely. I bought at 21 3/16.

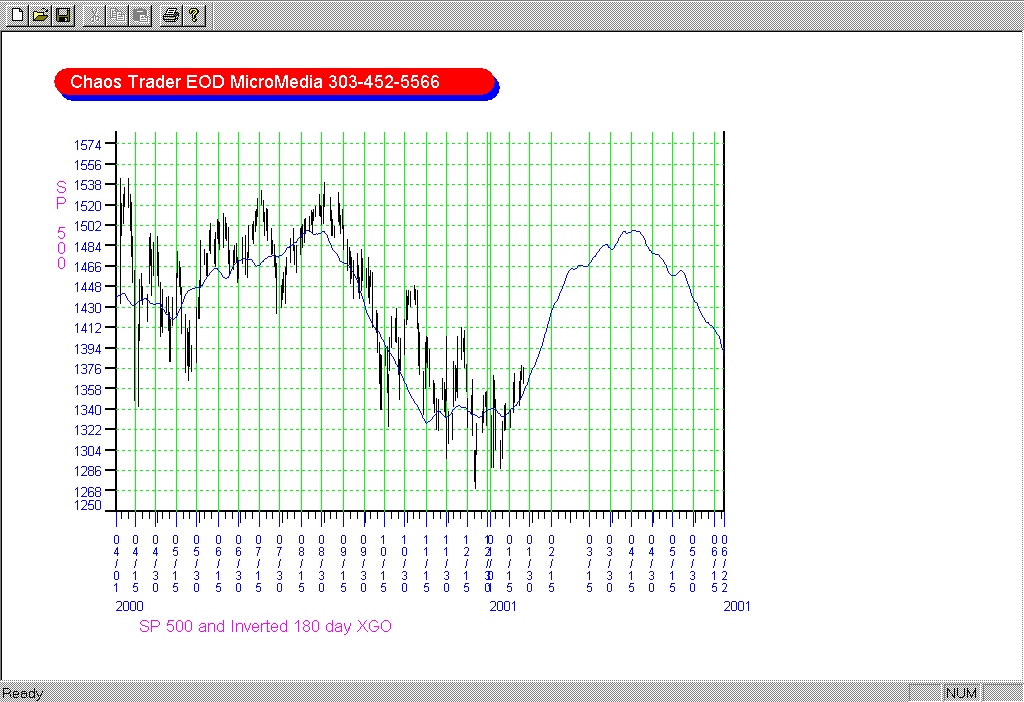
This chart shows the 180 day energy cycle in the S&P. It is computed by filtering the S&P XGO energy with an optimal filter, using our new found method. It has turned up. It looks like the next dip or breakout should be bought.

Keep in mind that at this point we are dealing with new technology, in the process of being discovered. This series will serve to document our progress. So far, so good.