
AUG 12, 1999
The last solar eclipse of the Millenium was this week. As reported two weeks ago, this was a major astrological event, as the eclipse came dead on a Grand Cross pattern. Around the world, especially in Europe, crowds gathered to watch this event. So it obviously stirred up the natives. It's approach has had the US stock market declining sharply for almost a "Moonth."
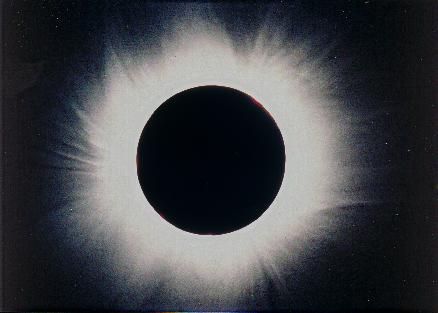
If you were not able to view this event in person, you could via the Internet. Here is what the eclipse looked like in Munich.
Now, did this event affect markets? Was there any order in the chaos? Observe.
First, note that this chart is almost the chart of the Lunar Eclipse (see Moon In Action - LXVIII) turned upside down. Even the two day range is about the same.
The eclipse occurred before the market opened, at 11:12 UT, or 7:12 Eastern. The price cluster at A, at 1288, was set by the Sun, +M180, and Node electric field flux lines. This point was a chaotic Strange Attractror/Repellor. For weeks, prices were being attracted to this point. Once the point was passed in time, it became a Strange Repellor.
B and C point to the MoonTide lines. The market followed the +MoonTide on the 11th, and the -MoonTide on the 12th. There seems to have been a left shift, but I have not adjusted the plots.
The key point was that prices had declined to the 1288 level, and were searching for support. They found it at D, where they bounce off the +M180 flux line.
Prices then rallied along the diagonal white and yellow electric field flux lines, cause by the rotating earth and the Moon's day harmonic. Note how "tight" these lines are. They formed a wonderful "Tunnel Through the Air" (E) up to F, where prices met the -M090 Moon electric field flux line. They then dropped into a down channel along the diagonal flux lines at G. See how exactly the prices moved from the +M180 flux (H) to the -M090 flux (J) ? Isn't that neat?
As prices made that move, note that they moved up 6 "grids" in the diagonal pattern, shown by the arrow at K. The S&P runs on the 6th harmonic. This is yet another example.
Two weeks ago, prices declined below the price set by the lunar eclipse. That repelled them lower. Now, they have rallied above above the eclipse price. That will repell them higher, at least for a while.
The ancients talked about signs in the sky. The high is July came as the Moon and Venus formed a Fertile Cresent. Now we have a low on the solar eclipse, another sign in the heavens. These signs work through the earth's electric field, as I have clearly shown (remember- all the flux lines are pre-computed). This eclipse is yet another example of the beauty of the system.
![]()
![]()