
This piece is dedicated to my mother, Dorothy, who yesterday
returned to her state of pure energy, in the spring of her 84th year. It is she who taught me to observe the wonders of nature.
She was always teaching harmony, and she sure picked a harmonic time to make her exit.
When she did, I awoke instantly, at 2:30 AM. It's all in her chart. Her exit came on the
Moon's Node, part of the eclipse cycle. I associate it with the soul.
This one's for you, Mom.
Here are two pictures of the solar eclipse of June 21st, 2001. This eclipse occurred on the Summer Solstice, and as Mars was at its closed point to earth.

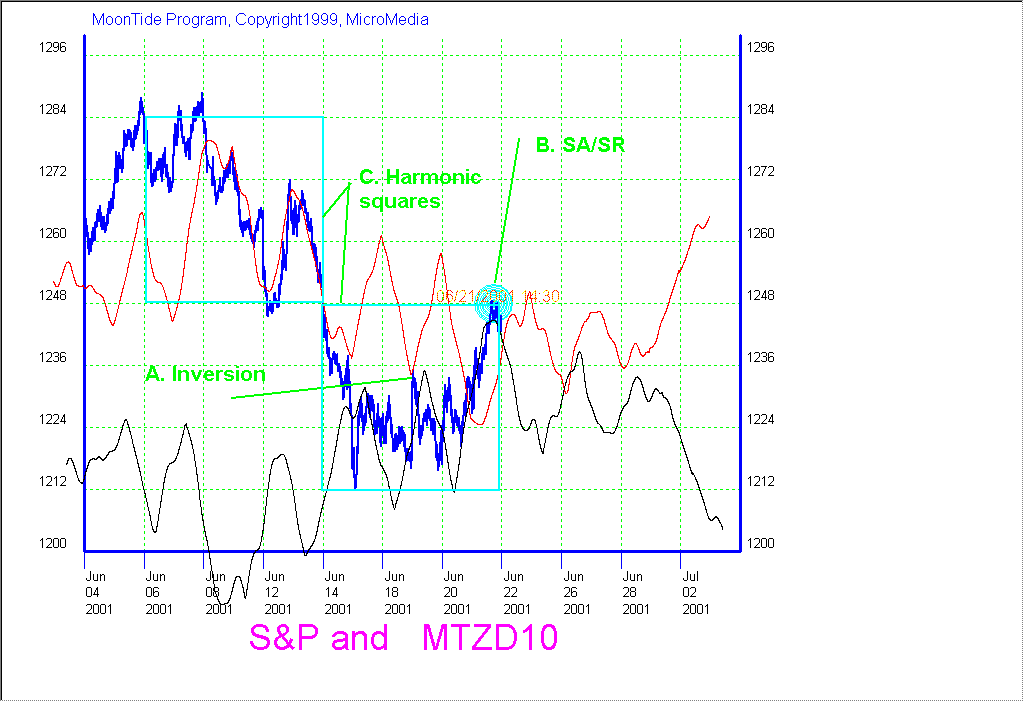
This is a longer term view. It shows the S&P over about a month of trading days.
In this chart, the blue line is the S&P, the red line is the 10 day MoonTide (MTZD10), and the black line is the inverted (-) 10 day MoonTide.
On the 8th, prices started down, following the red -MTZD10. On the morning of the 19th, prices opened sharply up, and sold off all day, signaling an inversion to the +MTZD6.
This inversion was more easily seen today, as the market rallied sharply to above the price set by the eclipse-1242. This rally was the sign of a Strange Attractor/Repellor (SA/SR). This SA/SR was found using the Face of God pattern, taught in my Face of God Course. Prices were obviously attracted to the eclipse point.
But after time (and the physical event) passes, the SA/SR becomes a repellor. It can repel prices up or down away from the center. But which way?
The answer is easy. If they move up from 1242, they are likely to continue up. If they drop below 1242, expect a decline. The MTZD6 is indicating a decline, right back to the 1224 level where prices vibrated earllier.
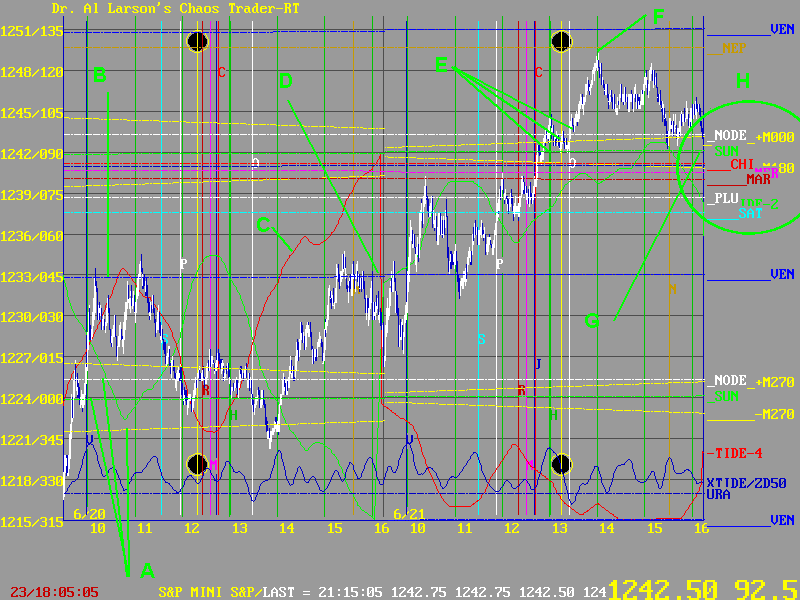
The next chart is a two day close-up.

A points out the flux bundle of the Moon, Node, and Sun, as the eclipse is forming. B points out the flux of Venus, which had been repelling every rally. The red line at C is the -MoonTide. The green line at D is the +MoonTide. Together they traced out much of the price action.
Today, as the exchange rotated past Venus at 10:00, it "went harmoic." since Venus had now reached 45 degrees. As prices ovecame that former resistance, they headed for the eclipse point, shown at E.
They even passed through it. The fianl high came at 2:00, 1 hour after solar noon. And the high was 6 points above the eclipse point. Can you figure out why? Hint-nature likes symmetry. How far below the 1224 balance point did prices go?
Prices had a lot of help on this attractor. H shows the flux bundle, formed by the Harmonic Convergence of Node, Sun, Moon, Jupiter, Mercury, Pluto, Chiron, Mars, Saturn, and Mercury. That's everyone except Venus, Uranus, and Neptune. But you even see them. Uranus set the low, Venus the midpoint, and Neptune set the high. And prices in the E-Mini closed just .5 off the level set by the eclipse.
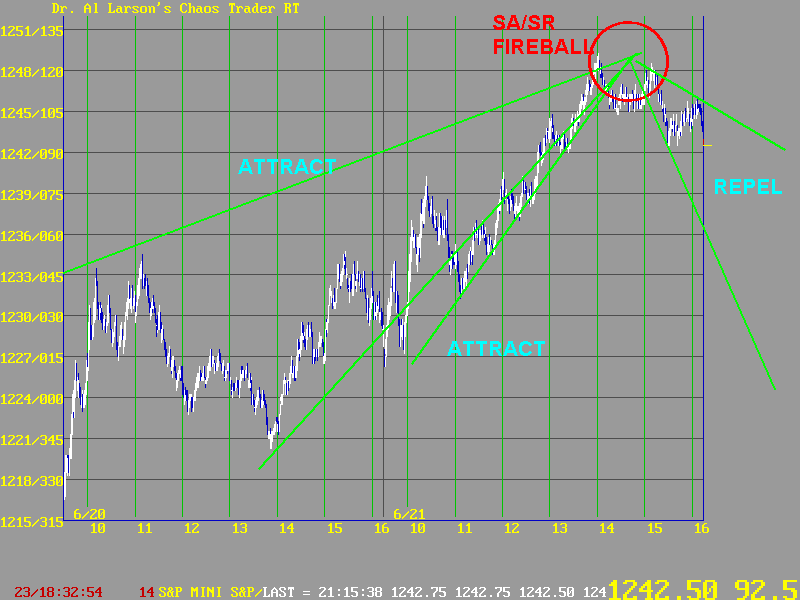
That's a physical picture. Here's a simplified Chaos Theory picture.

Prices move toward a SA/SR, then away from it. Often a SA/SR will form a Fireball. Just like this.
It is ALL in the energy fields. My mother told me so. Godspeed, Mom.