
January 22, 1999
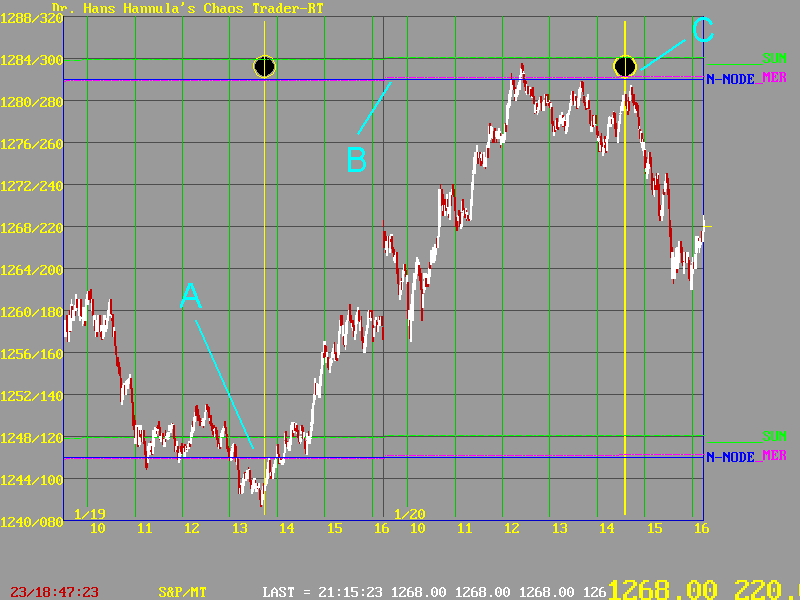
This week Mercury pulled prices up to the level of the S&P natal node. Mercury is coded in the Bible as Satan-probably because its orbit as seen from earth is erratic-a devil to compute. So one could say that Satan kissed the Node. And it was a kiss of death.
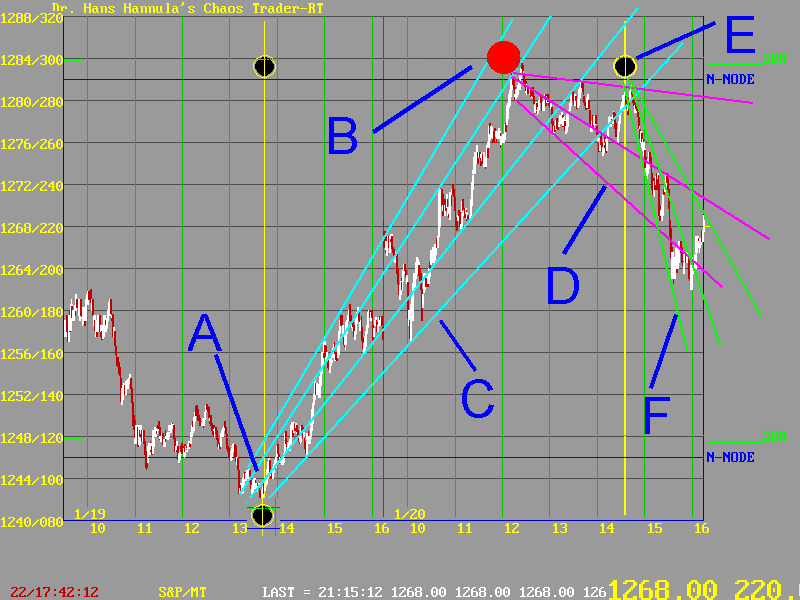
These points in the electric fields are part of a much more complex set of patterns. The overlapping fields form a chaotic system, in which prices move from one Strange Attractor/Strange Repellor (SA/SR) to the next. One can see the SA/SR's in the chart below.

The sun at B acted as a SA/SR. The "blast lines" away from it are shown at D. But SA/SR's often work together. Here, the Moon at E held prices up a bit, then the blast lines at F took over. And down went the market.
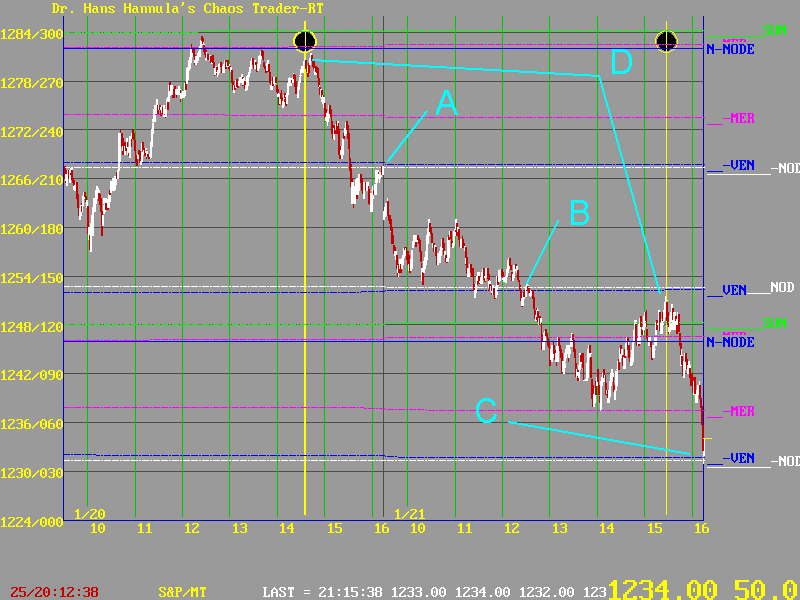
But Mercury and the Natal Node were not acting alone. Venus and the current Node were also involved. This chart shows their contibution.

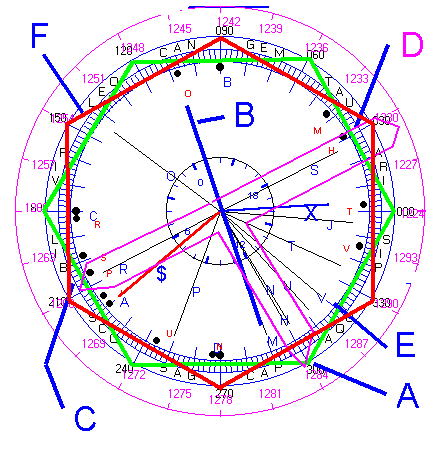
One can also look at the activity with an ephemeris wheel, as shown below.

The destabilzing effect of Mercury passing the Natal Node can be seen at B. The energy is offset from A by about 10 degrees, causing the hex to rotate toward the red unstable hexagon.
This unstable hexagon is being encouraged by the big T-Square (outlined in magenta) of Sun, Neptune, Mars, and Saturn, shown at A,C, and D. This shows once again how squares can cause hexagons to rotate, moving them from stable to unstable positions.
Finally, the Venus 180 degrees to current node is shown at E. It is closest to a corner of the vertical hexagon, so it will tend to strengthen that.
So everything works together. The planets set up waves in the earth's electric field. These waves harmonize in various ways. The market ( and those who trade that market) tune into these waves, and prices move - randomly - but chaotically.
That's the order underlying the chaos.