
JAN 27, 2000
Were you surprised by the big drop in the market this week? Not if you were paying attention to my weekly email. Last week I sent out a copy of this chart. It is based on a new forecasting technology.
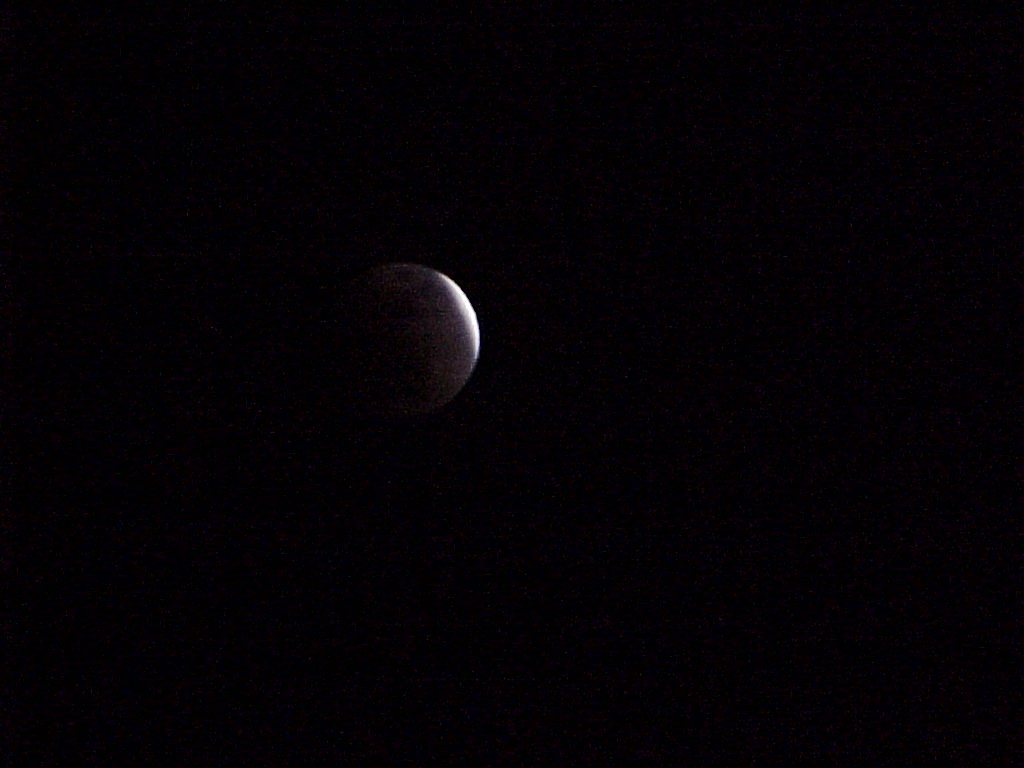
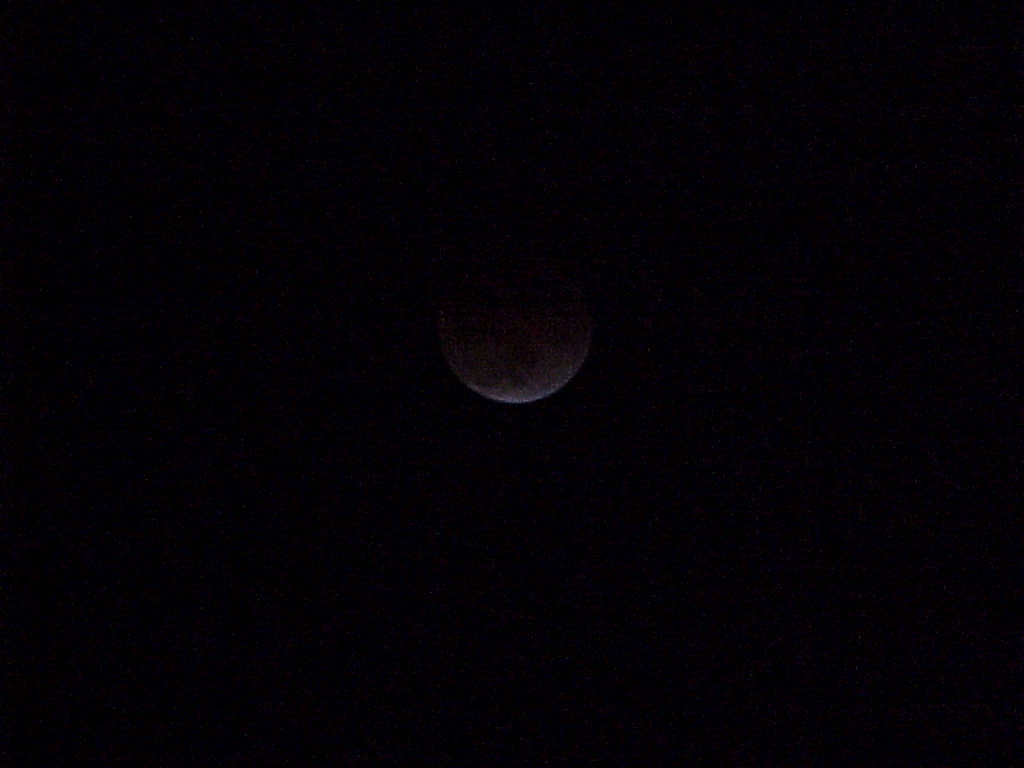
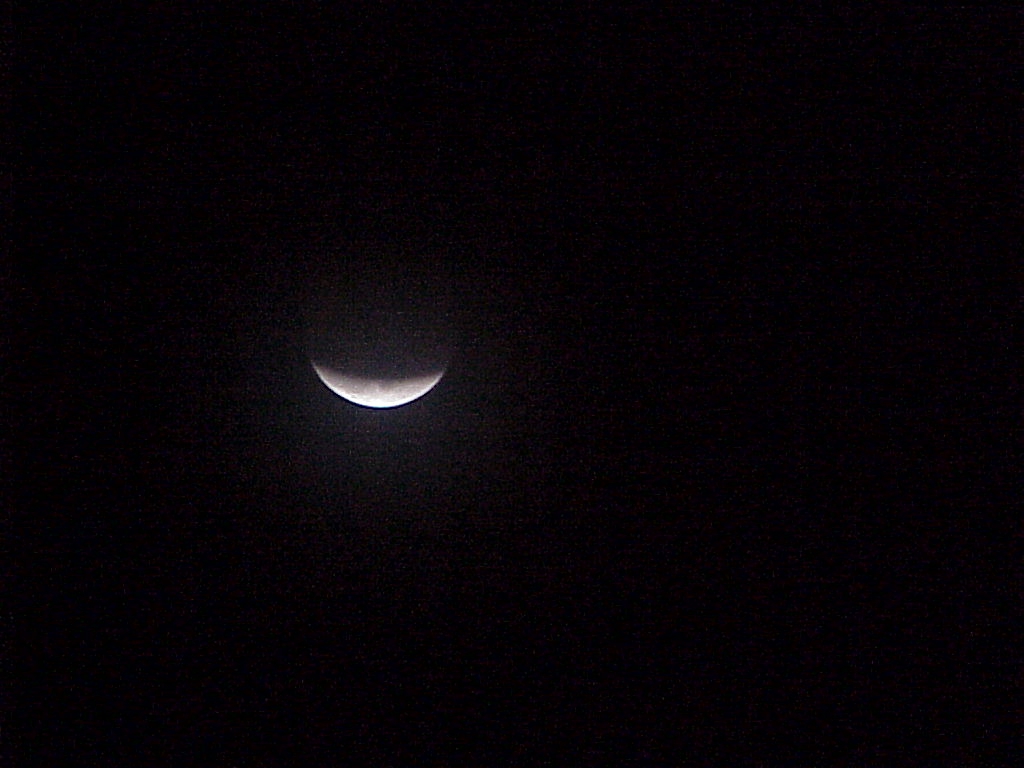
This chart showed a sharp drop. Of course, such a drop should be foretold by a SIGN IN THE SKY. You would have had to be under a rock to miss this one - the FULL LUNAR ECLIPSE the night of January 20th.
If you did miss it, here are photos I took with my digital camera.
This is the forming eclipse.
OK, so how did this SIGN IN THE SKY show up in the market? Let's look at the details.
This chart shows the S&P on January 20th and 21st.

B is the FULL MOON lining up with the Exchange. It is approaching the Moon's Node, Sun, and Mercury at C. The electric field flux cluster due to these planets is at C, at 1464. Note that the +M000 electric field flux due to the Full Moon is just under this bundle, rising to be above it on the 21st.
This "applying aspect" caused a "streak" move, shown in red at E. This streak was stopped only by the light blue Saturn electric field flux line.
That streak drove prices below the point set by the eclipse. That point is shown at F. This is the center of the chaotic Strange Attractor/Repellor for the eclipse. Note how prices in the afternoon of the 20th were attracted to this point.
Then on the morning of the 21st, after the eclipse overnight, prices were repelled down. That was a clear confirmation that the eclipse would REPELL PRICES DOWNWARD. This agreed with the -MoonTide red forecast at G. But it was a choppy day. Prices bounced off the -M180 Moon electric field flux line.
On our position trading hotline, which was short 2 from 1460, we parked a sell 6 at 1445 stop, just under the late Moon support. When you are right, load up.
Then came Monday.
Prices opened right on the 1464 eclipse price level, shown at A. That flux bundle of Sun, Node, and Mercury set the price point -but the Moon had moved over the weekend. It was no longer adding energy at this point.
The +MoonTide forecast at B said down, up, down. And we got it - bigtime. The market declined to the -M180 Moon electric field flux line, and held there until the Exchange passed the Sun, Neptune, and Mercury at C.
Then we got the big drop - attracted by the Full Moon at D, where it's -M000 electric flux line was at. Again, that was a Strange Attractor/Repellor. Note that after passing that point, prices were repelled upward.
Tuesday was a congestion day. With the Quarter Moon entering the market, things changed. This was a "two moon day." Prices followed the pattern of the -MoonTide at E. But they basically vibrated between the +M090 and -M270 flux bundle at 1422, and the +M000/-M000 flux bundle at H at 1404.
When we saw the dip below this 1404 bundle and recovery above it late in the day, we covered half of our 8 short contracts for a nice 159 point gain. This put us in position to hold the remainder short with a stop to claim a small profit. We covered these 4 because we have a high respect for the "departing Full Moon" at J. That position can cause a violent late streak move that will take back your gains.
Now on to the next two days.
Monday was another, lower range, congestion day. Prices followed the +MoonTide at A, but with "squashed" range. The high was set by Venus at B, and the low by the +M000 Moon electric field flux line at C.
Prices were "captured" by the Chiron/Pluto/-M270 flux bundle, with a little support from the Saturn flux line.
Then came Thursday, with an early rally right up to the Moon +090, Sun, Node, Neptune, Mercury flux bundle at D. They stopped the rally cold at 1428.
Then, as the Exchange approached these planets at E, another slide began. It found support at the +M000 flux line. Prices then dropped to the Moon +M270, Sun, Node, Neptune, Mercury flux bundle at F. The price swing was about 180 degrees.
So as the Moon squared the eclipse point, prices went to both of the Moon's square flux lines, +M090 and +M270. Then they rallied at G to close near the +M000 Full Moon flux line.
They did not. The markets are not easy to understand, but they do work on Market AstroPhysics and Chaos Theory. And you can use the knowledge of these topics to make some money. You have to LEARN TO EARN.
In early December, I nearly died. I'm nearly fully recovered now, but that reminded us all that we are mortal. One client got very concerned that he didn't have enough of my material, and that I wouldn't be here forever. That's a valid concern. So if you want to learn more, this is a good time to act. The Sweetheart special is usually the best of the year.
![]()
![]()