
JAN 5, 2000
Were you surprised by the Millenium Drop? If you read my Dec 16, 1999 page, you should not have been, for the drop was shown in the last chart.
But a forecast on a chart is only a forecast. What I was looking for was a SIGN IN THE HEAVENS. If you have read all the past MOON IN ACTION pages, you know that I watch rising (morning) signs and setting (evening) signs. I have a general rule that says setting signs are bullish and rising signs are bearish.
The new millenium began with a rising sign on the morning of January 3rd. Unfortunately, it was cloudy, so I could not photograph the sign, but here is a computer generated view of it. It shows the New Moon conjoining both Venus and Pluto. This computer program does not show Chiron, but it was there, two.
This is the photo I took the morning of Jaunary 4th. Pluto and Chiron are too small to be seen in the photograph, but I have marked their position.
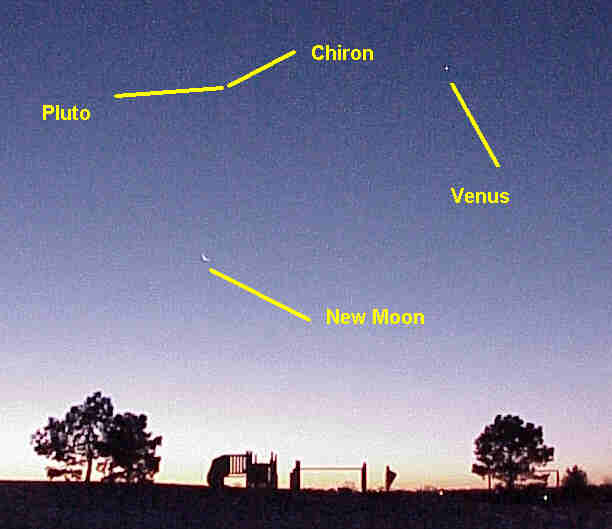
So did this sign show up in the market? Of course, it did. Here is exactly how.
The market opened gap up on the 3rd, immediately making a high on the Mercury flux line at H. It is beyond the scope of this discussion to explain why Mercury was a player here, but is is covered in the FACE OF GOD course.
Prices quickly dropped to the Moon/VEN/CHI/PLU flux at J, as the Exchange rotated past the NEW MOON (vertical yellow line with black ball) and Pluto and Chiron, shown by the vertical lines labled with the red C and blue P. That tight cluster of flux set off a steep slide.
This was as forecast by the +MoonTide, shown by the green line K. Note that while it lacked detail, it was a decent forecast over these three days.
The first low came at L, right on the Moon/VEN/CHI/PLU flux. That was the low of Monday. After that low, the market rallied modestly up into the Quarter Moon, at M. That meant Monday was a "two Moon day." Often these mark intermediate changes in trend.
On Tuesday,prices opened on the Moon/VEN/CHI/PLU flux at L, peaking exactly as the Exchange passed CHI/PLU. from there they began to drop as called for by the MoonTide, down to the quantum level of Moon flux lines at P. The low came as the Exchange passed the Moon's NODE, shown by the vertical line labeled with the white O.
Prices sagged lower, finding support on the Venus line of the Moon/VEN/CHI/PLU flux cluster, until breaking lower late in the day at Q. That warned of a probable drop to the next quantum level.
On Wednesday, the MoonTide showed an early rally. Overnight, the yellow Moon flux lines had "crossed over." Look closely and you will see that the rising and falling yellow lines crossed. This often is very close to a significant turn.
Prices again dropped after the open, expecially after the Exchange passed Chiron and Pluto. But the were stopped cold by the Moon and Mercury electric field flux lines at R. At this point, the decline had moved 6 quantum levels ( of 90 degrees each). The move was harmonically complete.
Prices then jumped two quantum levels to peak exactly on a Moon/VEN/CHI/PLU flux cluster, as the Exchnage passed the New Moon, at S.
From there, they sagged one level to the low at T. This level sent prices up until the Exchange passed Mars, at U.
Did we make money? Not on our day trading - too much chop for our tight stops. But on the position trading hotline we picked up 110 points. So it does help to understand what is going one. It's all Market AstroPhysics in action.
![]()
![]()