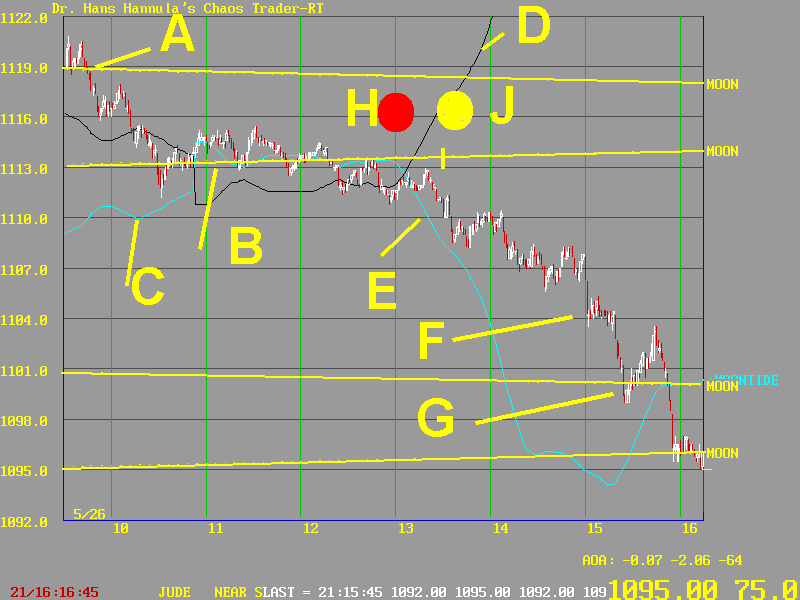


This chart shows the S&P 500 on May 26, 1998.
The market began on -Moon Flux line A. The +MoonTide at C was forecasting a sizable drop ( or rally if inverted). The key feature was an acceleration after solar noon at 13:00 Eastern, shown as the red ball at H.
That's where we put our One-A-Day trade. We suspected that the move wouldn't really take off until the Exchange passed the New Moon at 13:23, shown by the yellow ball at J.
Prices declined early, then congested about the +Moon electric field flux line B for several hours. Approaching solar noon, prices weakened, and fell below the moon line. This suggested the New Moon and the Sun were both "strange repellors."
The One-A-Day trade sold at 1110 and cashed in 6 points at 1104. By our scaling, that looked like a reasonable gain. We felt that a "band gap jump" would make that much if it went from Moon flux line B to Moon flux line G.
Prices did find support at G, but a very late decline carried them even lower. No matter, the +MoonTide forecast made us excellent MOONEY. Never worry about what you missed. It wasn't yours.
I don't trade every day. But I did this day. I spotted the trade a week earlier when looking at MoonTides. That's one advantage of a physical calculation. It can help you be selective.