
May 25, 2000
If you watched the evening news on 5/5/2000, you may have heard a story about the gloom and doom forecasts being made by many-the earth will tip on it's axis, tide waves will destroy New York and several other major cities, volcanos everywhere will erupt, and 80% of the world population will perish. All brought about by the alignment of planets in Taurus.
That didn't happen. But I told my wife that the alignement would show up in the markets. My last piece gave some of the close up detail. Here is a longer term perspective.

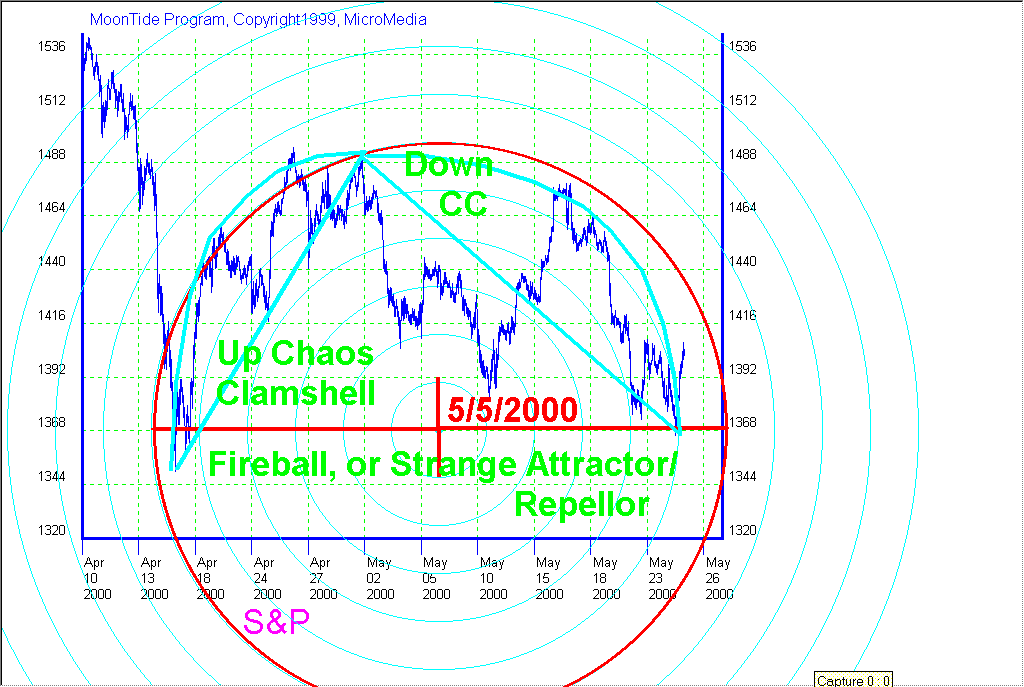
This chart shows a huge "fireball" of energy centered on the close of 5/5/2000, and a price of 1468, which is 0 degrees on the Wheel of Fortune. All the price action is contained ih the top half of the fireball.
In my Market Chaos theory, prices move form one Strange Attractor/Repellor (SA/SR) to the next. If one can find the centers of the SA/SR's, one can see where the energy is flowing to, and that helps anticipate price movement.
These SA/SR often act as a hot stove-when prices get close, they skirt around the stove, as if it is too hot to touch. That's the case here. The bigger the circle of the "fireball", the more powerful it is.
The key is to watch how prices depart the SA/SR. They are being repelled away from the center. In this case, they are being repelled UP. Isn't that what you would expect from a cluster of planets in Taurus, the Bull?
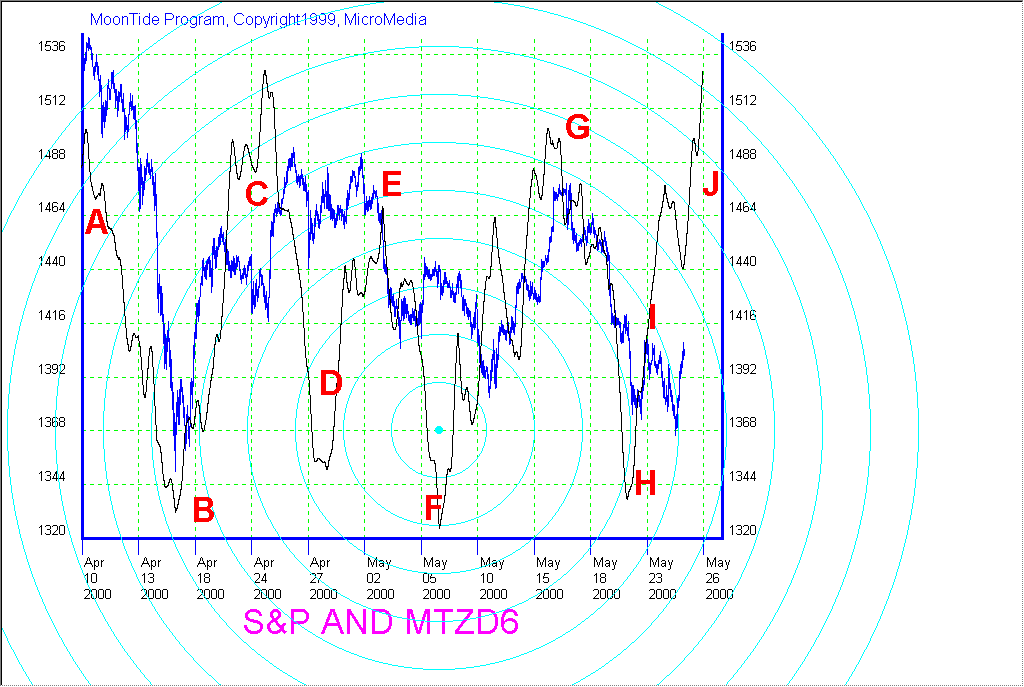
So how are the MoonTides involved? Well, the 6 day MoonTides, which I get by applying a 6 day Zero Delay (ZD) filter to the raw MoonTides, give a pretty decent forecast of the weekly swings in the S&P.

This 6 day forecast is all done with "vertical" math. This computes the magnitude of the energy flow, but does not model the direction, or rotation of the flow. So when a fireball forms, it distorts the 6 day MoonTide. You can see that in this chart.
The forecast was good from A to B and into C. During C and D, the fireball dampened the swings. At E prices followed the Tide, but the swing at F was again dampened, although it got the timing of the center very well. The move to G and down to H were very accurate. At I, prices fell off the Tide, being caught by the fifth arc from the center.
This all goes to show that the markets are driven by physical energy, and that this energy flow can be modeled with Chaos Theory and mathematics. Doing so can give you a trading edge. This is down im my MoonTide software, which produced the charts on this page.
Also, my main tool for finding the SA/SR's is the Face of God pattern, taught in the Face of God course. Graduates of that course can see an extention of this page in the FOGGER'S ROOM.