
|
Written June 20, 2002 The solar eclipse of June 10th, 2002 occurred at a price in the S&P of 1023. The market has reacted strongly to that event, and it has helped form some interesting patterns on the intraday charts. Here are two examples of my S&P Harmonic Grid chart: 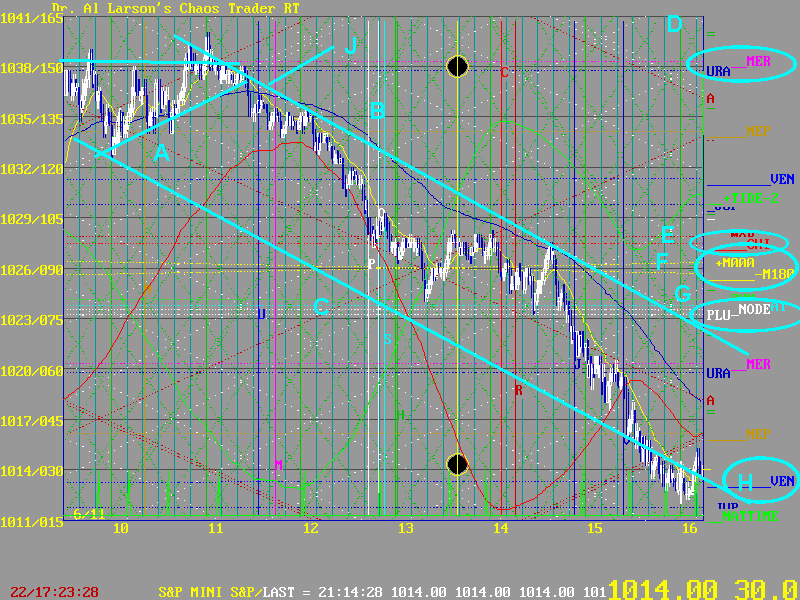
On the day after the eclipse, prices opened under the eclipse price plus 90 degrees, which would have been 1041. Failure to square the eclipse suggested a move to the eclipse price at 1023. At A, prices formed a converging triangle between the double white line in the Grid and the Mercury/Uranus electric field flux at D. As the Exchange passed Mercury, at J, the triangle broke down, triggering a sell on our EXMA system. This set up a move within the Harmonic Grid channel B and C. This channel held all day. Midday, the market did flatten out as it formed a small trading range between the Mars/Chiron flux pair at E, and the Saturn/Pluto/Node/Sun flux bundle set by the eclipse, at 1023, shown by G. This midday congestion was centered about the Moon flux pair at F, which crossed midday. Late in the day, near 2:30, prices tried to rally, hit the top of the congestion range and top of the Harmonic Grid down channel, and dropped the rest of the day, finally closing on Venus, the evening star, at H. This suggested prices would square the eclipse 90 degrees below the eclipse price, or 1005. They did that early the next day. This is a good example of a perfectly formed Harmonic Grid channel. This next one isn't as good, but not bad. 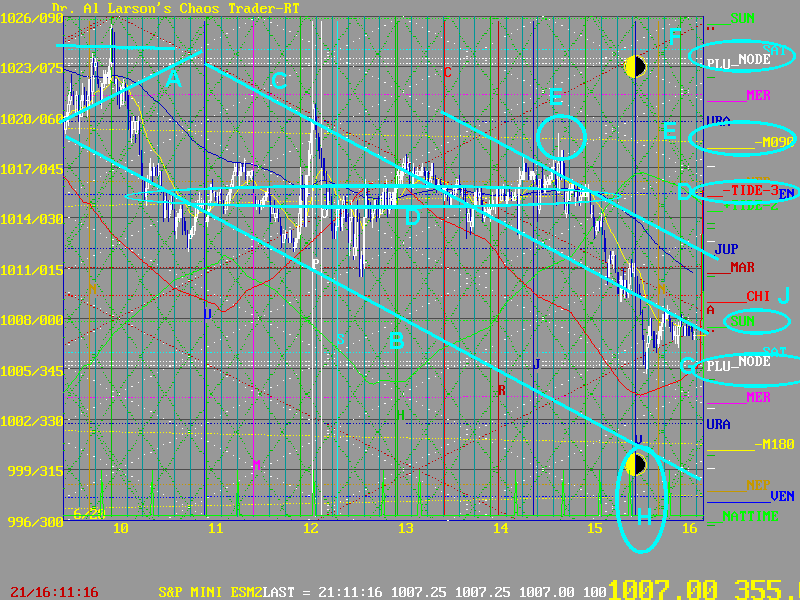
This chart is for June 20th, a day when the Moon squared Venus. Because the Exchange passed the Moon and squared Venus early in the day, then passed Venus and squared the Moon late in the day, I expected volatility early and late, with a midday congestion. Prices opened at the 1023 eclipse level (persistent, eh?) and again formed a converging triangle at A. The break gave a "continuation sell" signal on our trading system, and again set up a Harmonic Grid down channel B, C. This time the Moon flux lines were not crossing midday, but instead formed a wider congestion zone. For 4.5 hours, prices did nothing except vibrate about the 1015.5 price, set by the Moon and Venus electric field flux lines. Think about that- a river of money flowing billions of dollars per day was stopped dead in its tracks by the Moon and the Evening Star! That is some pretty awesome power. It was clear that this dam would break before the day ended, as the Exchange passed Venus and Squared the Moon near 3:30, shown at H. The break came on the sharp rally at E. The yellow Moon flux line sharply reversed the rally, and the congestion was ended. The long congestion had, however, shifted the Harmonic Grid channel to K and J. The drop was over when prices hit 1005, at G. They closed square the Sun, at J. Very fitting going into the summer solstice. So once again, the Moon played at will with the S&P. Without our tools, there would be no way to understand what was going on in these two cases. But with our tools and knowledge, we made good money both days, and that is what it's all about. Study-understand-learn-earn. |
![]()
![]()