
|
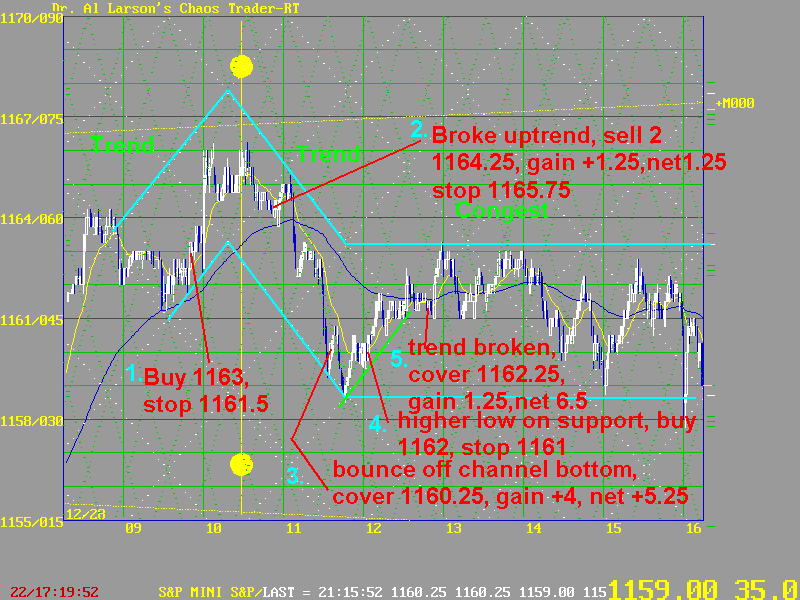
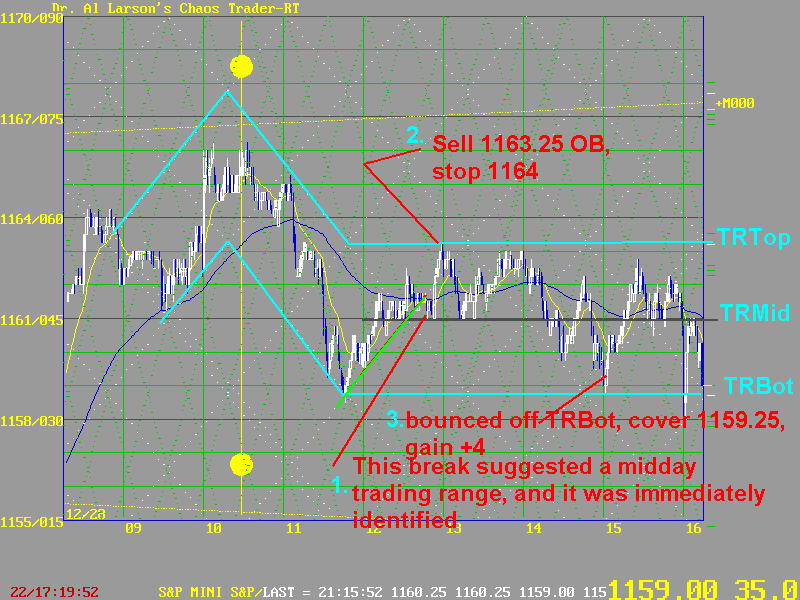
Written December 28th, 2001 The purpose of this page is show how the S&P 500 Harmonic Energy Grid worked today. Look carefully at the charts, which are annotated to show how 3 trend trades and one congestion trade all made money on a choppy, dull, year-end day. 
These trades worked off the white diagonal lines. The Moon early in the day pulled the market up, then let it down. But the trades were done just off the diagonal white harmonic lines. 
The trend often goes flat midday, and the flat blue 110 minute EXMA warned of that possibiliy. When the rally broke the diagonal line, it signalled the start probable of a congestion. This means to switch tactics, and sell near the top of the range and buy near the bottom. The Harmonic Grid identified where the range was. do this congestion trade risked .75 for a possible 4.5 gain. Nice tool, eh? |