
April 19, 1999
Last night I witnessed a sign in the evening sky. The Moon was occulting (blockin out) the bright star Alebaran, as it conjoined Venus. I was already expecting a volatile day on Monday, due to the Moon, Venus, and Pluto alignment. But let's start with what I saw.

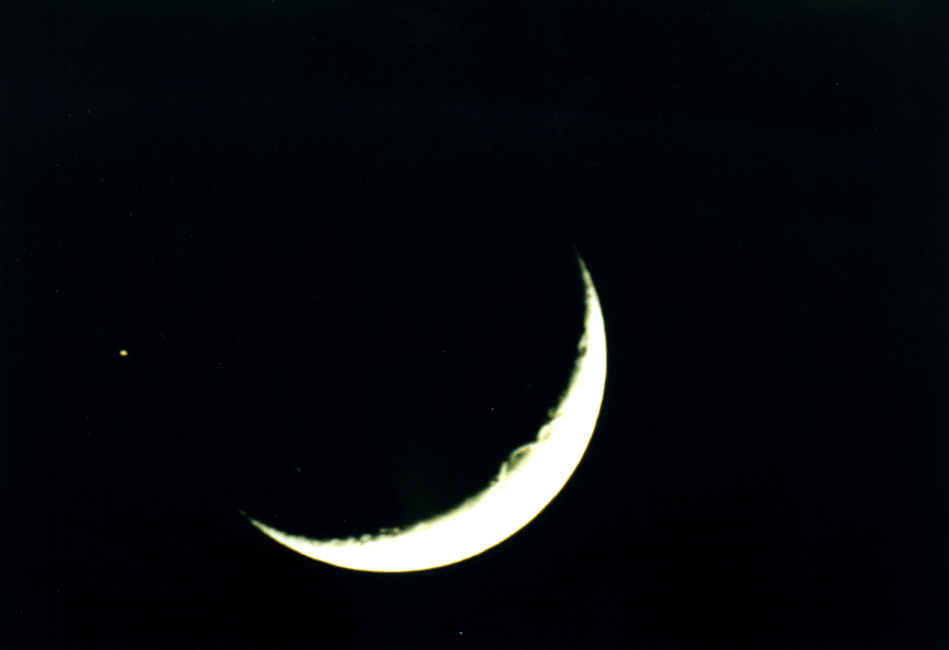
This is the view looking west toward the Rockies. North Denver is in the foreground. This picture shows the Moon too bright, due to blooming. The moon was really just a "fingernail Moon." They often mean market tops, especially aligned with Venus. That combination is called the "Fertile Cresent." It shows up in the flags of several nations. This aligment did not put Venus exactly in the cresent, but it did put Aldebaran there.
Here is a closeup taken through my telescope.

This was taken just minutes before Aldebaran disappeared behind the Moon. Astrolgers have for centuries attached special significance to planetary aspects which are also occulting a star. If there is any substance to this, this change should show up in the market. I have formed a general impression that an evening (setting) sign usually means a rally, and a morning (rising) sign means a decline, either of which may be reversed during the day.
So what happened?

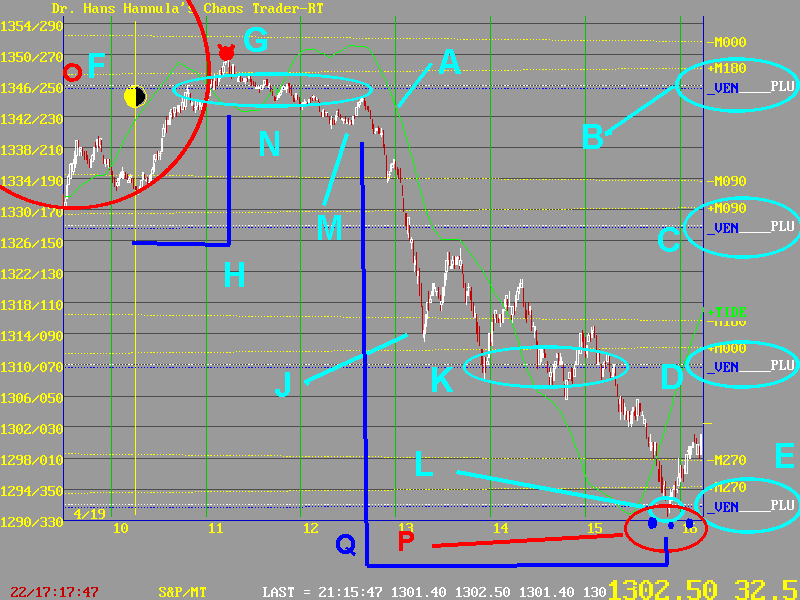
The market opened gap up, and continued the rally. This was forecast by the MoonTides shown in green at A. Prices climbed sharply to about 1348, a price level set by the +M180 (New Moon), Venus, and Pluto electric field flux lines. The flux line for Aldebaran would also be here. This flux cluster is shown at B. Other flux clusters are shown at C, D, and E.
Prices rallied, forming a quarter of a fireball shown at F. The center was on the Moon flux line. Just past the edge of the fireball, the Exchange lined up with Mercury, at G. This point was exactly 1 hour after the Exchange passed the Quarter Moon, shown at H. For two hours, prices hovered near the Venus flux line, shown at N. At M, the Moon was 300 degrees (sixth harmonic) to the Moon's Node. This Moon-to-Node aspect was forecast by the MoonTides to be the key turning point of the day.
It was. The S&P dropped 180 degrees (36 points) to J, a cardinal price point, then further to K, the Venus,Moon,Pluto cluster. They conjested there for nearly two hours, then dropped to a final low, at L, bouncing off the Venus,Moon,Pluto, (and Aldebaran) flux lines at L.
Finally, note the three small blue dots at P. That is where the Exchange passed Venus, Pluto, and Aldebaran. Right after the close, it lined up with the New Moon. Further, the late low came 3 hours from the break at M, shown by the line Q. This is 1/8th of the day, a harmonic number. It was set by Mercury being 45 degrees from Uranus. So the Moon and Node set up the 6th harmonic and Mercury-Uranus set up the eight, and the battle created a chaotic move.
That sign in the night sky set the high price, the low price, and the low time of the day. So maybe those ancient astrologers were on to something. If only they had know about electricity. Ah, maybe they did.