
February 4, 1999
OK, last week's Moon fireball pushed prices up, after initially sending them sharply down. Such is the nature of chaotic systems. When that happens, it means there is another Strange Attractor/Strange Repellor (SA/SR) at work. In this case it was the BLUE MOON LUNAR ECLIPSE on Sunday.
So I had egg on my face. That happens. Murphy's law of chaotic systems says, "If you only put one MoonTide line on your chart, the market will immediately switch to the other one."
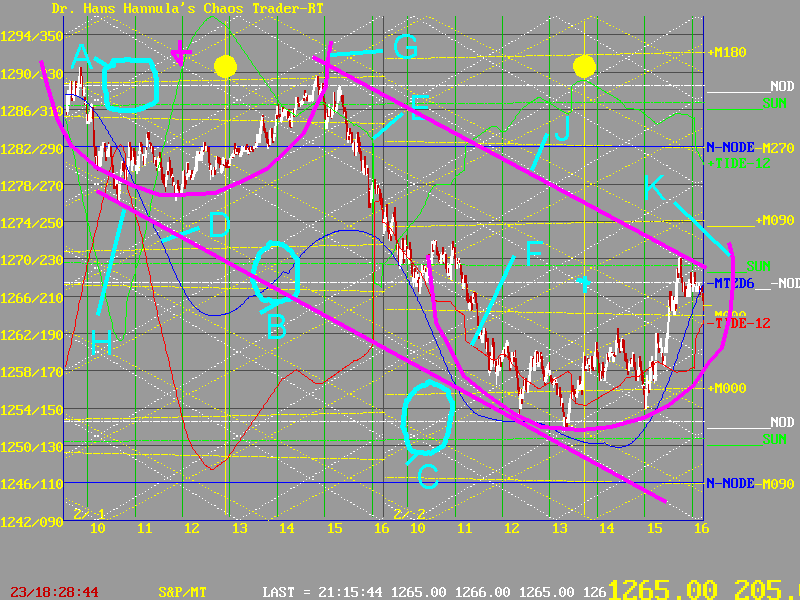
This chart shows the eclipse fireball.

The cluster of electric field flux lines at A are the Sun, Full Moon, and Moon's Node lines, which were separating on the open on Monday. It is the Full Moon lining up with the Earth and the Sun and the Moon's Node that forms a lunar eclipse. These physical events cause patterns in the Earth's electric field, which can be modeled with flux lines. Prices respond to these flux lines, so one can connect price action to the flux lines formed by the event (provided one knows how).
These flux lines repeat each quantum level, as shown at B and C. Prices will tend to jump between these quantum levels.
D points to the -MTZD6, the 6 to 8 day MoonTide. Prices generally followed it over these two days. E points to the green +MoonTide, which the market followed on Monday. F points to the red -MoonTide, which the market followed on Tuesday,
The eclipse caused a Fireball pattern on Monday, marked at G. It is centered at 12:00, when the Exchange lined up with the Sun, as part of the lunar eclipse. Note how the high near 3:00 Eastern hit the +M180 (Full Moon) electric field flux line. After that, it was all downhill.
The Fireball on Tuesday, shown at K, centered on the Full Moon. Pretty neat how the Sun made one, and the Moon made the other, isn't it?
The "blast channels" are shown at H and J. Note how these tended to follow the diagonal white and yellow lines, which are electric field flux lines formed by the rotating earth and the Moon.
Finally, look very closely and find the blue line near 1282, labeled on the right N-NODE. This is again the S&P 500 natal node flux line. In early January, the Sun passed it to set the January top (see THE NODE KNOWS). Now the Moon passed it to set a retest of the top. In both cases, the market was repelled away from this line. That sets the tone for the year, which looks to be down.
So there is an order underlying the Chaos in markets. Learning how it works can give you an edge in your trading. You have to learn to earn.