
December 4, 1998
Today the market dropped sharply in the last hour. This page explains what was happening. It was a DOUBLE FULL Moon, plus friends that created the CHAOS.

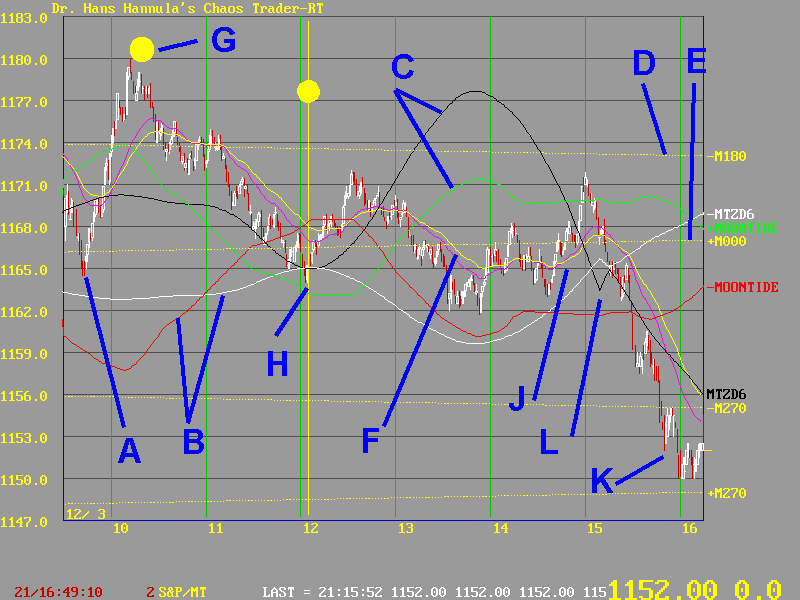
This chart shows the price action of the S&P500 on December 3, 1998. Prices are shown by the red and white one minute candelsticks at A. The lines at B are the -MTZD6 (6-8 day MoonTides) and the -MoonTide line. Prices had been following them for several days.
Lines C and E are the +MTZD6 and +MoonTide lines. Note that the market mostly followed them. Personally, I did not anticipate that, since prices had been tracking the -MTZD6 and -MoonTide lines well. But there was a cause for this switch to the other set. These switches are called "bifurcations" in chaos theory.
D and E show the -M180 and +M000 Moon electric field flux lines. Note how prices spent most of the day trading near these lines. That was anticipated on our hotline. We even anticipated the 55 minute exponential moving average (shown at F) dropping lower in the afternoon. We expected a break above this line to lead to a good trade as we bought the break above the 55 minute EXMA.
The first clue that things were not as expected came with the opening rally up to G. G marks the point at 10:19 Eastern when the FULL MOON was exact. This is when the earth, Moon, and Sun are exactly in a line.
The Second FULL MOON symbol at H is when the Moon lined up with the stock Exchange. Here prices made a low, continuing to suggest that the +MoonTide and +MTZD6 were in effect.
But then for the next three hours, prices and the EXMA's followed the -MTZD6 and -MoonTide. Our One-A-Day trade (a buy) was elected, but then stopped out for a -2.9 loss. When prices rallied into 3:00, it looked like we had be stopped out of a winner. But rules are rules. One must absolutely contol losses, even at the price of missing a few winners.
But just after 3, the market dropped like a rock. It did a band gap energy jump from the +M000 flux line (due to full moon), down to the lower pair of flux lines at -M270 and +M270, shown at K.
Was there anything that happened to cause this drop? Yes. Mercury helio was zero degrees to the moon at 3:57. There was also another clue.
Look carefully at the black -MTZD6 line. It has a "jerk" in it at L. In the past, jerks in the basic MoonTides have warned of sharp moves, so apparently this also holds for the ZD filtered MTZD6 MoonTides.
Of course there was much more going on. The next chart shows the ephemeris wheel for today.

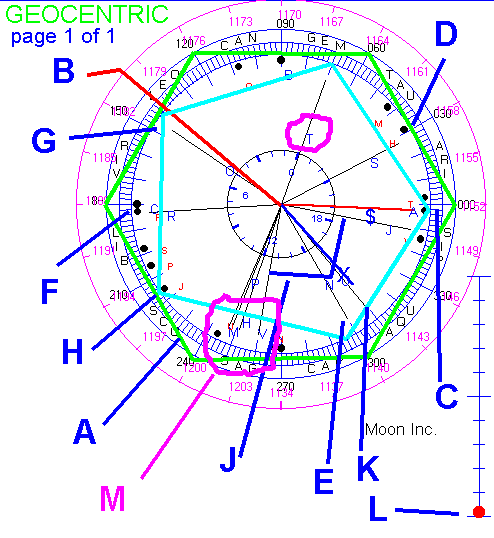
Start with the cluster of Mercury, Pluto, Sun, and Venus opposing the Moon (T) circled in magenta and labeld M. This is a very high energy cluster, and is what has powered the market up. But now it is separating, and can potentially turn the market down as Mercury, Sun, and Venus move away from Pluto.
The S&P hexagon is shown in green at A. This is the stable one. B mark the high price, which came very close to the Moon's Node (O). This came right at the moment of the FULL MOON. A FULL MOON on the NODE is an ECLIPSE. This isn't a real eclipse (Those come in January and February), but for prices, it acted like one.
What that high did was set up a 5th harmonic vibration, shown with the light blue pentagon. This shift to the 5th harmonic dropped prices from the high, to the common point of the 5th and 6th harmonics marked at C. This point is on the Moon's natal moon, shown by the small red T. The red line with the blue $ sign is the closing price.
I have written previously about action on the midpoints of the hexagon causing instabilities. One such point is shown at D, where Saturn is approaching the S&P natal Sun (small red H). Another is shown at G where the Moon's node is currently. Then, as the planets Mercury, Sun, and Venus move past the bottom of the cirlce, they will tend to destabize the stable hexagon.
There are many other itmes to note. At F, Mars is making a return to it's natal position. At H, a corner of the Pentagon is on natal Jupiter. This comes as Earth is 1/5th of a cirle, or 72 degrees past where it lined up with the Sun and Jupiter heliocentrically. At E, Neptune is squaring Saturn. This is a BIG CYCLE of 36 years. A major turn here could cause a multiyear bear market. I have been watching that cycle closedly. At K, Uranus is moving away from Neptune. The closing time aligned with this.
At J, Venus is shown squaring Jupiter. It is in the midpoint of the Pentagon, which could cause further instability. Finally, at L, the moon is approaching maximum negative inclination, which maximizes its effect.
So the DOUBLE MOON turned the market sharply down. Tomorrow could be even wilder. With both the 5th and 6th harmonics having destabizers on the midpoints of the sides, we could see even more chaos.
One last thing. Yes, I saw the late inversion and shorted it. That made up for the early buy attemp. Sometimes I'm lucky. Remember, luck happenes to those who are prepared. I strive to understand why markets behave the way they do, and to teach others. One has to learn to earn.