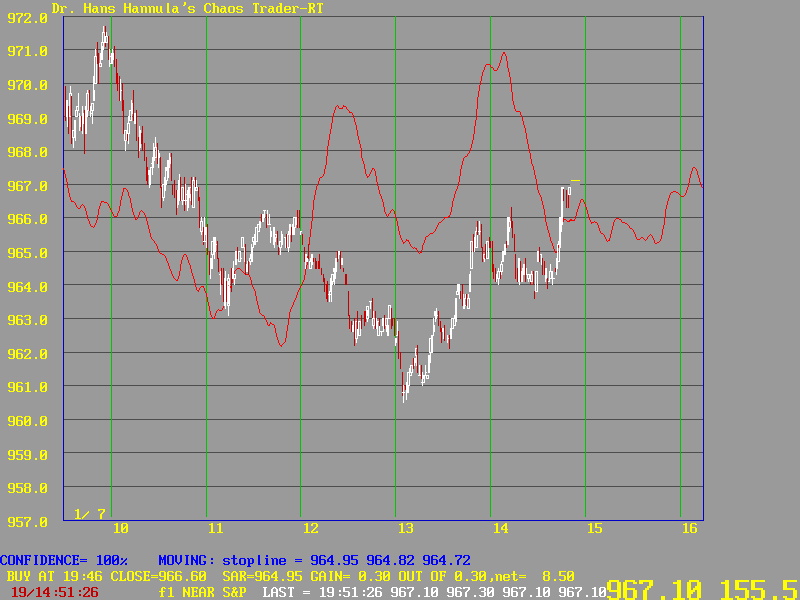


FIGURE 12
Figure 12 shows the market a few moments later. The sell stop has not been hit and the market has rallied three points in the last 5 minutes. The forecast curve has been adjusted to current price levels and is suggesting that the trader not follow this rally, as the forecast is for congestion into the end of the trading day. Since congestion is expected, it is unwise to enter a trade.