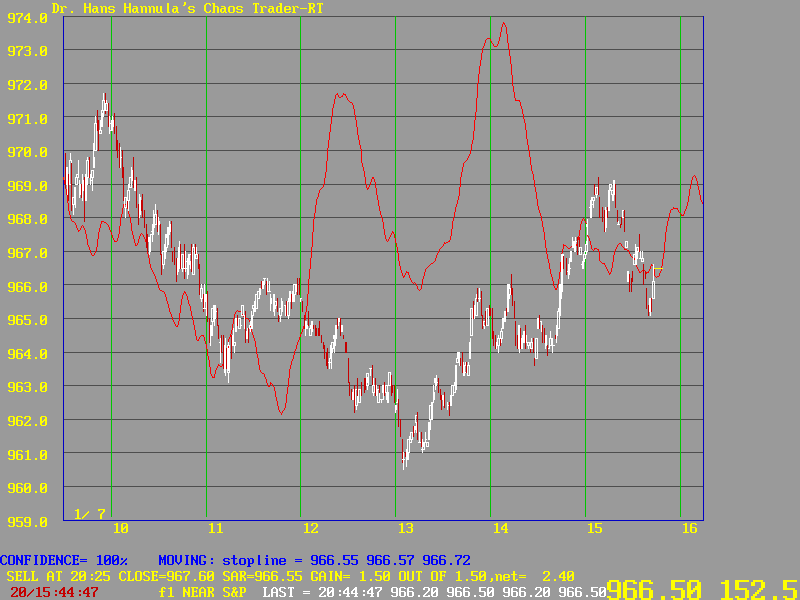


FIGURE 13
Figure 13 shows the ensuing market action along with the inverted forecast. The rally did fade very quickly. Going into the close the market is very close to where it opened. Notice in this figure that the inverted forecast called the market very well during the first two hours and then was off about an hour, called it well if the forecast had slid down for another two hours, and is now calling the market accurately.
It is forecasting a rally into the closing bell. A day trader should be cautious about taking this late rally even if it looks like it might be quite promising. However, should the trader for some reason be short at this point it is clearly a time to cover.