|
WinXGO Software
XGO is a formula for computing future stock and commodity prices. It is
a very unique formula. It computes the natural energy collected from the universe
by an
individual or a market.
I discovered it as I awoke on January 23, 1996. The formula was just in my head.
All I had to do was write it down. Since then XGO
has been available to individual traders, and has been used in my work.
Several articles and
sales brochures have been produced. They are collected here for
your browsing. Some material may repeat in each, since each was
written to stand alone, but each has new material as well.
The original XGO function was implemented as a DOS command line program.
When it was first marketed, several web pages were created. These give a basic
background for this technology.
|
Cashing In On Natural Energy-- Basic Overview
Cashing In On XGO-- More info, still basic
The XGO Software-- The sales brochure
Sample XGO Trades--- Some more examples
And a more recent example of using XGO for swing trading (separate window)-
[ Taming the Fed With XGO ]
|
Over the next 8 years, I and several of my clients used this DOS version of XGO.
In particular, Dr. Greg Meyer discovered that the XGO energy function could be
filtered to bring out the longer term cycles in a market. Meanwhile, the
world of computing changed from DOS to Windows. In December of 2003,
I created a Windows version of XGO called WinXGO, and packaged it up with
a light weight version of my ChaosTraderEOD (end of day) charting program. This program
can be downloaded in a trial version, which works up until the Chinese
New Year of January 22, 2004. (Hmm-seems this product runs on the 8 year Venus place cycle.)
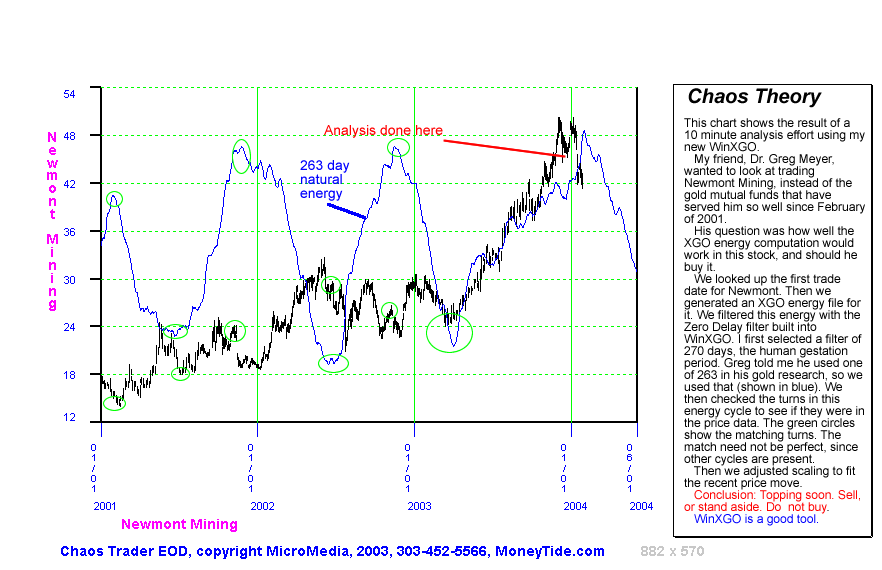
This annotated chart gives a brief overview of one use of this program.
The key point shown here is that this tool extracted the cycle driving the
stock for the last 10 months, and showed that the cycle was topping.
Here ia another example:
My broker recently suggested I should buy General Electric-GE. I always check out his recommendations
with my own tools.
I first looked up the first trade date for GE. It is 5/27/1927. I then used WinXGO to generate
3 forecasts for GE, each tuned to a different cycle. The Jupiter 12 year cycle has been shown to
be a mover of stocks. So I computed a 1752 day ZGO for GE (.4 x 12 years).
It is shown below. Note what a great job it did
of forecasting the rise and fall of GE doring the DotCom Mania.
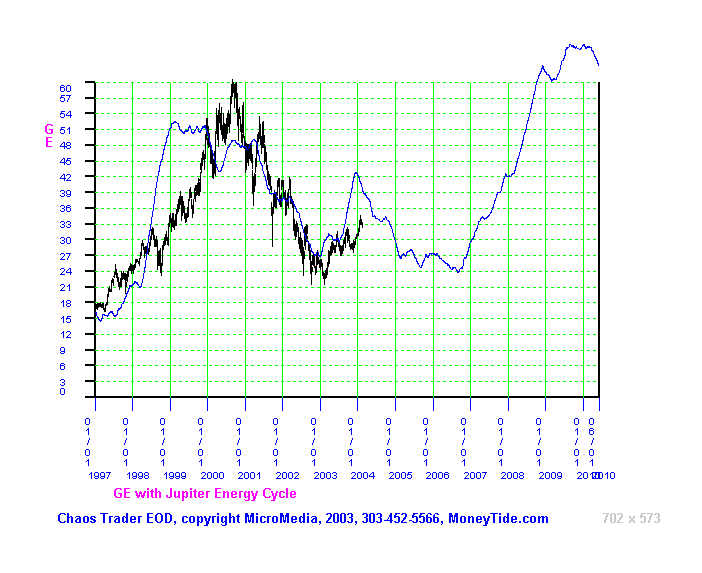
That cycle looks to be topping!
The second cycle I computed was the annual cycle. Jupiter spends 12 months in a sign, while the
Earth goes around the Sun once. So this cycle shows up strongly in stocks. To get it, I commputed
a 146 day ZGO (.4 x 365). This cycle of the year is shown below.
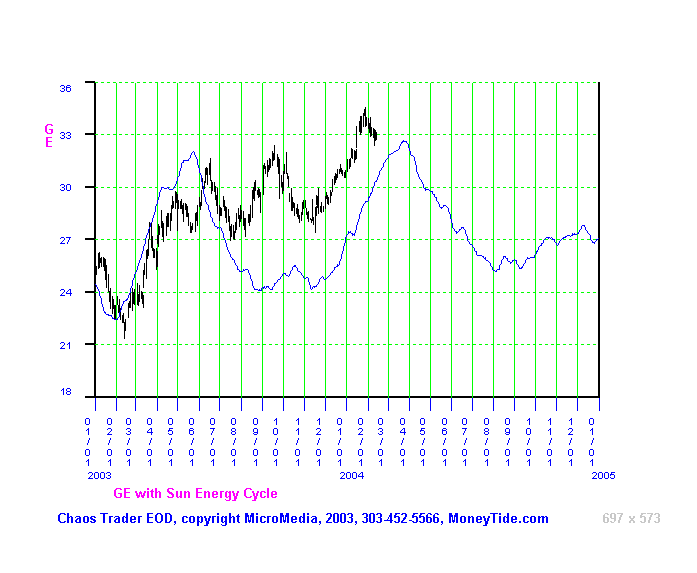
That cycle is topping soon.
Finally, I wanted to see what the Moon was doing to GE. This took me two calculations, first on
a 11 day ZGO, which was too choppy, and then on a 22 day ZGO (.8 x 28 days) . This fit the data fairly well,
as is shown below.
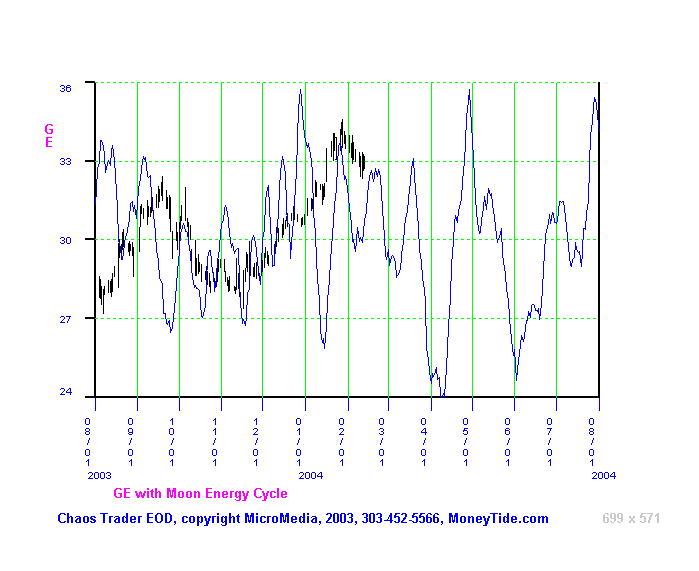
With this analysis in hand, I decided to ignore my broker's advice. In fact, I may even shop for a put option.
And I'll be watching for a buy in 2006.
I know of no other tool which can do this, all based on first principles of energy, all done without
doing any curve fitting to price. WinXGO can be a very valuable trading tool.
To let you see how valuable it might be to you, I have placed the entire manual online.
Reading through this will tell you exactly what this sofware does.
You can read it at:
WinXGO Manual
After reading that, you can watch a video demo of how to use it.
You can do so with this link:
WinXGO Demo Video
When you are satisfied that this tool should be in your trading suite, go to the
Cash In On Chaos Catalog
to place your order.
| 